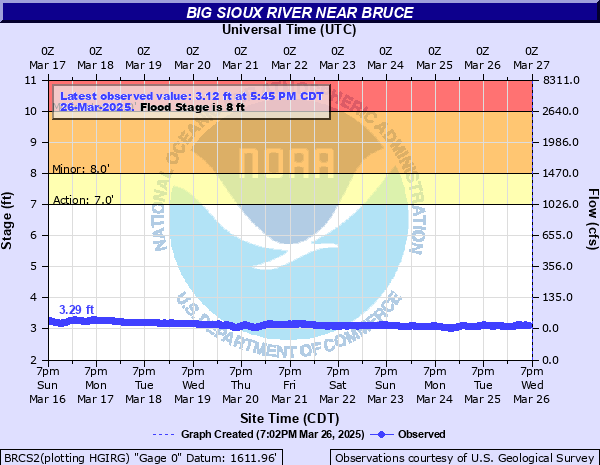
Big Sioux River near Bruce
Critical Stages
7' - Action
8' - Flood
10' - Moderate
13' - Major
Latest Observation
Updated: 1:45 PM CST 12/15/25
Status: No Flooding
Stage: 4.84 ft
Flow: 0.312 kcfs
Forecast
Forecast not available for this location.
| Time | Stage (ft) | Flow (kcfs) |
|---|---|---|
| 2:45 PM 12/15 | 4.84 | 0.312 |
| 2:30 PM 12/15 | 4.84 | 0.312 |
| 2:15 PM 12/15 | 4.84 | 0.312 |
| 2:00 PM 12/15 | 4.84 | 0.312 |
| 1:45 PM 12/15 | 4.84 | 0.312 |
| 1:30 PM 12/15 | 4.84 | 0.312 |
| 1:15 PM 12/15 | 4.85 | 0.313 |
| 1:00 PM 12/15 | 4.85 | 0.313 |
| 12:45 PM 12/15 | 4.85 | 0.313 |
| 12:30 PM 12/15 | 4.85 | 0.313 |
| 12:15 PM 12/15 | 4.85 | 0.313 |
| 12:00 PM 12/15 | 4.85 | 0.313 |
| 11:45 AM 12/15 | 4.85 | 0.313 |
| 11:30 AM 12/15 | 4.85 | 0.313 |
| 11:15 AM 12/15 | 4.85 | 0.313 |
| 11:00 AM 12/15 | 4.84 | 0.312 |
| 10:45 AM 12/15 | 4.84 | 0.312 |
| 10:30 AM 12/15 | 4.84 | 0.312 |
| 10:15 AM 12/15 | 4.84 | 0.312 |
| 10:00 AM 12/15 | 4.84 | 0.312 |
| 9:45 AM 12/15 | 4.84 | 0.312 |
| 9:30 AM 12/15 | 4.83 | 0.31 |
| 9:15 AM 12/15 | 4.84 | 0.312 |
| 9:00 AM 12/15 | 4.83 | 0.31 |
| 8:45 AM 12/15 | 4.83 | 0.31 |
| 8:30 AM 12/15 | 4.85 | 0.313 |
| 8:15 AM 12/15 | 4.83 | 0.31 |
| 8:00 AM 12/15 | 4.83 | 0.31 |
| 7:45 AM 12/15 | 4.82 | 0.308 |
| 7:30 AM 12/15 | 4.83 | 0.31 |
15' -
The bridge on 466th Ave is overtopped.
14' -
Water overtops 466th Avenue near the gage.
13' -
Water reaches the bottom of the bridge on 203rd street northwest of Bruce. Water will begin to surround multiple structures and homes near the gauge location.
11.5' -
The higher banks on the left side of the river are overtopped, flooding agricultural lands for a width of 1/4 to 1/3 mile. The water also reaches the low steel of the bridge at the gaging location on 466th Avenue and 203rd street begins to flood.
10.5' -
198th Street and 199th Street between 466th and 467th avenues are flooded, as is 202nd Street between 465th and 467th avenues, and 465th Avenue between 203rd and 204th streets.
9.5' -
The right bank overflows flooding agricultural lands for as much as 1/4 mile.
8' -
The lower banks on the left side of the river overflow.
| Date | Stage (ft) |
|---|---|
| Mar 28, 2011 | 12.16 |
| Mar 29, 2019 | 10.88 |
| Mar 24, 2009 | 10.75 |
| Apr 9, 2001 | 10.6 |
| Apr 4, 2011 | 10.52 |
| Jun 25, 2013 | 10.46 |
| Mar 16, 2010 | 10.37 |
| Mar 15, 2007 | 10.35 |
| Apr 23, 2018 | 10.2 |
| Apr 11, 2023 | 10.17 |
| Apr 13, 2023 | 10.17 |
| Mar 30, 2002 | 9.01 |
| Mar 30, 2020 | 8.8 |
| May 14, 2022 | 8.24 |
| Feb 21, 2017 | 8.01 |
| Jun 24, 2024 | 7.85 |
| Mar 17, 2003 | 7.54 |
| May 12, 2008 | 6.99 |
| Jun 2, 2014 | 6.77 |
| Mar 12, 2006 | 6.56 |
Data provided by the National Weather Service.