Split Rock Creek at Corson
Critical Stages
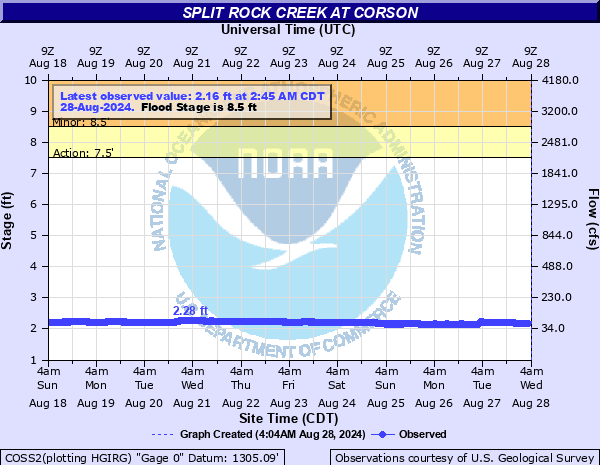
7.5' - Action
8.5' - Flood
11' - Moderate
14' - Major
Latest Observation
Updated: 1:45 PM CST 12/15/25
Status: No Flooding
Stage: 1.93 ft
Flow: 0.0076 kcfs
Forecast
Forecast not available for this location.
| Time | Stage (ft) | Flow (kcfs) |
|---|---|---|
| 1:45 PM 12/15 | 1.93 | 0.0076 |
| 1:30 PM 12/15 | 1.93 | 0.0076 |
| 1:15 PM 12/15 | 1.93 | 0.0076 |
| 1:00 PM 12/15 | 1.93 | 0.0076 |
| 12:45 PM 12/15 | 1.93 | 0.0076 |
| 12:30 PM 12/15 | 1.93 | 0.0076 |
| 12:15 PM 12/15 | 1.94 | 0.0078 |
| 12:00 PM 12/15 | 1.93 | 0.0076 |
| 11:45 AM 12/15 | 1.93 | 0.0076 |
| 11:30 AM 12/15 | 1.93 | 0.0076 |
| 11:15 AM 12/15 | 1.93 | 0.0076 |
| 11:00 AM 12/15 | 1.93 | 0.0076 |
| 10:45 AM 12/15 | 1.93 | 0.0076 |
| 10:30 AM 12/15 | 1.92 | 0.0074 |
| 10:15 AM 12/15 | 1.92 | 0.0074 |
| 10:00 AM 12/15 | 1.92 | 0.0074 |
| 9:45 AM 12/15 | 1.92 | 0.0074 |
| 9:30 AM 12/15 | 1.91 | 0.0072 |
| 9:15 AM 12/15 | 1.91 | 0.0072 |
| 9:00 AM 12/15 | 1.91 | 0.0072 |
| 8:45 AM 12/15 | 1.91 | 0.0072 |
| 8:30 AM 12/15 | 1.91 | 0.0072 |
| 8:15 AM 12/15 | 1.91 | 0.0072 |
| 8:00 AM 12/15 | 1.91 | 0.0072 |
| 7:45 AM 12/15 | 1.91 | 0.0072 |
| 7:30 AM 12/15 | 1.91 | 0.0072 |
| 7:15 AM 12/15 | 1.91 | 0.0072 |
| 7:00 AM 12/15 | 1.91 | 0.0072 |
| 6:45 AM 12/15 | 1.91 | 0.0072 |
| 6:30 AM 12/15 | 1.91 | 0.0072 |
20' -
260th St begins to flood west of the bridge.
19' -
Water reaches the bottom of the bridge on McHardy Rd.
16' -
Highway 11 north of Corson is flooded and may be closed. McHardy Rd may begin to flood.
14' -
Water approaches Highway 11 north of Corson and may begin to flood the lowest spots.
12.5' -
The athletic fields at Pioneer Park begin to flood.
11' -
The nursery near the mouth of Split Rock Creek begins flooding if the Big Sioux River is high enough to cause a backwater effect. Highway 11 north of Highway 42 can be flooded if Beaver Creek flows are also high.
9' -
The parking lot at the racetrack may be flooded and the lower portions of McHardy Park begins to flood.
8.5' -
Flooding of the lower lying agricultural land begins.
5.5' -
Portions of the short walking trail in McHardy Park begins to flood.
| Date | Stage (ft) |
|---|---|
| Sep 12, 2019 | 19.01 |
| May 8, 1993 | 17.58 |
| Jun 22, 2024 | 16.18 |
| Jun 17, 2014 | 16.16 |
| Sep 24, 2010 | 15.5 |
| Apr 8, 1969 | 15 |
| Jun 21, 1984 | 14.08 |
| Sep 22, 1986 | 13.98 |
| Apr 7, 2006 | 12.82 |
| Jun 21, 2018 | 12.8 |
| Apr 1, 1997 | 12.8 |
| Mar 22, 1979 | 12.65 |
| Apr 24, 2001 | 11.95 |
| Mar 14, 2019 | 11.66 |
| Apr 19, 1995 | 11.65 |
| Jul 15, 2011 | 11.59 |
| Jul 1, 1992 | 10.69 |
| May 7, 2012 | 10.48 |
| Jun 13, 1994 | 10.48 |
| Jul 6, 2022 | 9.99 |
Data provided by the National Weather Service.