Rock River near Hardwick
Critical Stages
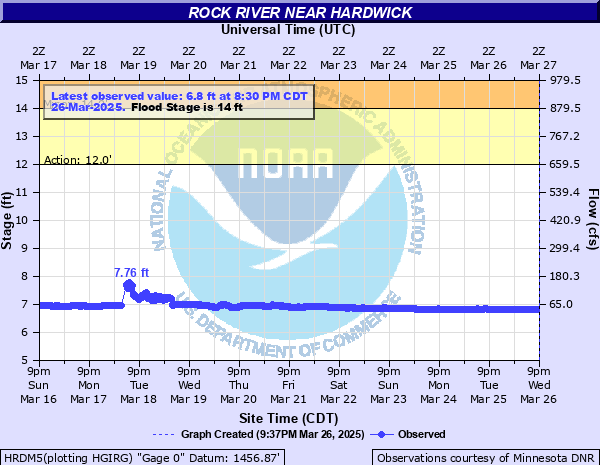
12' - Action
14' - Flood
17' - Moderate
22' - Major
Latest Observation
Updated: 1:30 PM CST 12/15/25
Status: No Flooding
Stage: 7.1 ft
Flow: 0.0753 kcfs
Forecast
Forecast not available for this location.
| Time | Stage (ft) | Flow (kcfs) |
|---|---|---|
| 2:30 PM 12/15 | 7.09 | 0.0742 |
| 2:15 PM 12/15 | 7.09 | 0.0742 |
| 2:00 PM 12/15 | 7.1 | 0.0753 |
| 1:45 PM 12/15 | 7.1 | 0.0753 |
| 1:30 PM 12/15 | 7.1 | 0.0753 |
| 1:15 PM 12/15 | 7.11 | 0.0764 |
| 1:00 PM 12/15 | 7.11 | 0.0764 |
| 12:45 PM 12/15 | 7.11 | 0.0764 |
| 12:30 PM 12/15 | 7.11 | 0.0764 |
| 12:15 PM 12/15 | 7.1 | 0.0753 |
| 12:00 PM 12/15 | 7.1 | 0.0753 |
| 11:45 AM 12/15 | 7.1 | 0.0753 |
| 11:30 AM 12/15 | 7.1 | 0.0753 |
| 11:15 AM 12/15 | 7.09 | 0.0742 |
| 11:00 AM 12/15 | 7.09 | 0.0742 |
| 10:45 AM 12/15 | 7.09 | 0.0742 |
| 10:30 AM 12/15 | 7.08 | 0.0731 |
| 10:15 AM 12/15 | 7.08 | 0.0731 |
| 10:00 AM 12/15 | 7.07 | 0.072 |
| 9:45 AM 12/15 | 7.07 | 0.072 |
| 9:30 AM 12/15 | 7.07 | 0.072 |
| 9:15 AM 12/15 | 7.07 | 0.072 |
| 9:00 AM 12/15 | 7.07 | 0.072 |
| 8:45 AM 12/15 | 7.07 | 0.072 |
| 8:30 AM 12/15 | 7.07 | 0.072 |
| 8:15 AM 12/15 | 7.07 | 0.072 |
| 8:00 AM 12/15 | 7.07 | 0.072 |
| 7:45 AM 12/15 | 7.07 | 0.072 |
| 7:30 AM 12/15 | 7.07 | 0.072 |
| 7:15 AM 12/15 | 7.07 | 0.072 |
24' -
The bridge at the gage is overtopped and County Road 8 is flooded.
21' -
The bridge on 175th St is overtopped.
19.5' -
Water reaches the bottom of the bridge at the gage on CR 8 and also the bridge on 175th St.
16' -
The lowest portions of the road near the intersection of 160th Ave and 175 St begin to flood.
15' -
More substantial agricultural flooding begins.
12' -
Nearby ditches are flooded and may spill over into low lying agricultural areas.
9' -
Very minor lowland flooding begins.
| Date | Stage (ft) |
|---|---|
| Jun 17, 2014 | 21.18 |
| Sep 12, 2019 | 19.99 |
| Mar 10, 2015 | 19.91 |
| Jun 22, 2024 | 19.89 |
| Apr 23, 2001 | 18.7 |
| Jun 21, 2018 | 17.1 |
| Mar 20, 2019 | 16.63 |
| Mar 14, 2010 | 16.03 |
| Mar 14, 2007 | 15.8 |
| Apr 12, 2023 | 15.36 |
| May 7, 2012 | 15.02 |
| Jul 6, 2020 | 14.24 |
| Jun 23, 2013 | 14 |
| Oct 4, 2017 | 12.72 |
| May 13, 2022 | 12.1 |
| May 1, 2016 | 11.09 |
| Oct 29, 2021 | 8.49 |
Data provided by the National Weather Service.