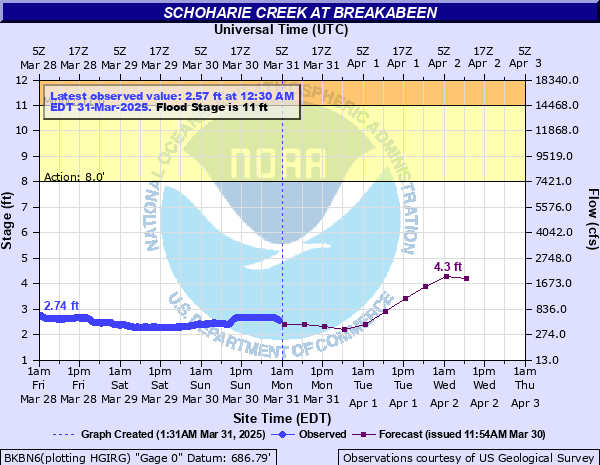
Schoharie Creek at Breakabeen
Critical Stages
8' - Action
11' - Flood
16' - Moderate
18' - Major
Latest Observation
Updated: 9:30 PM EST 12/14/25
Status: No Flooding
Stage: 1.32 ft
Flow: 0.0606 kcfs
Forecast
| Time | Stage (ft) | Flow (kcfs) |
|---|---|---|
| 1 AM 12/15 | 1.5 | 0.101 |
| 7 AM 12/15 | 1.5 | 0.101 |
| 1 PM 12/15 | 1.5 | 0.101 |
| 7 PM 12/15 | 1.5 | 0.101 |
| 1 AM 12/16 | 1.5 | 0.101 |
| 7 AM 12/16 | 1.5 | 0.101 |
| 1 PM 12/16 | 1.5 | 0.101 |
| 7 PM 12/16 | 1.5 | 0.101 |
| 1 AM 12/17 | 1.5 | 0.101 |
| 7 AM 12/17 | 1.5 | 0.101 |
| Time | Stage (ft) | Flow (kcfs) |
|---|---|---|
| 10:30 PM 12/14 | 1.3 | 0.057 |
| 10:15 PM 12/14 | 1.31 | 0.0588 |
| 10:00 PM 12/14 | 1.31 | 0.0588 |
| 9:45 PM 12/14 | 1.31 | 0.0588 |
| 9:30 PM 12/14 | 1.32 | 0.0606 |
| 9:15 PM 12/14 | 1.32 | 0.0606 |
| 9:00 PM 12/14 | 1.32 | 0.0606 |
| 8:45 PM 12/14 | 1.32 | 0.0606 |
| 8:30 PM 12/14 | 1.32 | 0.0606 |
| 8:15 PM 12/14 | 1.32 | 0.0606 |
| 8:00 PM 12/14 | 1.32 | 0.0606 |
| 7:45 PM 12/14 | 1.32 | 0.0606 |
| 7:30 PM 12/14 | 1.32 | 0.0606 |
| 7:15 PM 12/14 | 1.32 | 0.0606 |
| 7:00 PM 12/14 | 1.32 | 0.0606 |
| 6:45 PM 12/14 | 1.32 | 0.0606 |
| 6:30 PM 12/14 | 1.32 | 0.0606 |
| 6:15 PM 12/14 | 1.31 | 0.0588 |
| 6:00 PM 12/14 | 1.32 | 0.0606 |
| 5:45 PM 12/14 | 1.32 | 0.0606 |
| 5:30 PM 12/14 | 1.32 | 0.0606 |
| 5:15 PM 12/14 | 1.32 | 0.0606 |
| 5:00 PM 12/14 | 1.32 | 0.0606 |
| 4:45 PM 12/14 | 1.32 | 0.0606 |
| 4:30 PM 12/14 | 1.32 | 0.0606 |
| 4:15 PM 12/14 | 1.32 | 0.0606 |
| 4:00 PM 12/14 | 1.32 | 0.0606 |
| 3:45 PM 12/14 | 1.32 | 0.0606 |
| 3:30 PM 12/14 | 1.32 | 0.0606 |
| 3:15 PM 12/14 | 1.32 | 0.0606 |
22.37' -
Record flooding with Tropical Storm Irene in August 2011.
18' -
Major flood stage. Widespread inundation of homes, roads and fields occurs.
16' -
Moderate flood stage. Up to five feet of water is on some areas of Route 30 and one to two feet of water in some riverfront homes.
14' -
Water begins to reach riverfront homes.
13' -
There is about a foot of water on low parts of Route 30.
12' -
Water reaches Route 30.
11' -
Minor flood stage. Water begins to overflow into riverfront fields.
10' -
The river is bankfull.
8' -
Action stage.
| Date | Stage (ft) |
|---|---|
| Aug 28, 2011 | 22.37 |
| Jan 19, 1996 | 20.51 |
| Oct 16, 1955 | 20.4 |
| Apr 5, 1987 | 19.5 |
| Mar 21, 1980 | 18.34 |
| Apr 3, 2005 | 17.4 |
| Dec 25, 2020 | 16.87 |
| Nov 9, 1977 | 16.5 |
| Oct 27, 2021 | 14.94 |
| Sep 18, 2004 | 14.02 |
| Apr 8, 2022 | 13.57 |
| Mar 23, 2010 | 13.56 |
| Mar 14, 1977 | 12.98 |
| Apr 17, 2007 | 12.79 |
| Mar 11, 2011 | 12.61 |
| Mar 15, 1986 | 12.58 |
| Dec 18, 2023 | 12.39 |
| Mar 25, 1979 | 11.98 |
| Sep 7, 2011 | 11.9 |
| Jun 7, 2000 | 11.88 |
Data provided by the National Weather Service.