Schoharie Creek at Burtonsville
Critical Stages
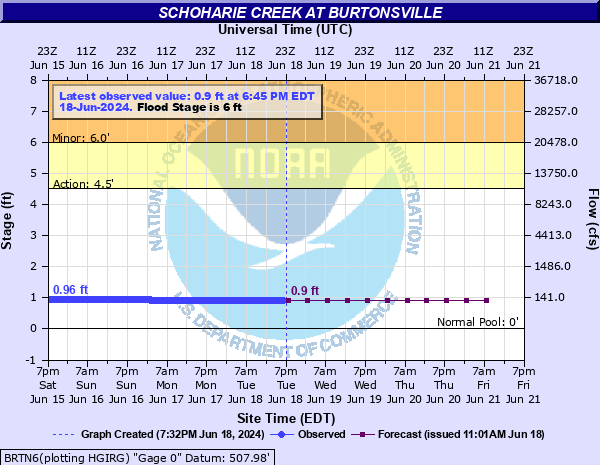
4.5' - Action
6' - Flood
8' - Moderate
10' - Major
Latest Observation
Updated: 9:45 PM EST 12/14/25
Status: No Flooding
Stage: 1.22 ft
Flow: 0.318 kcfs
Forecast
| Time | Stage (ft) | Flow (kcfs) |
|---|---|---|
| 1 AM 12/15 | 1.2 | 0.3 |
| 7 AM 12/15 | 1.2 | 0.3 |
| 1 PM 12/15 | 1.2 | 0.3 |
| 7 PM 12/15 | 1.2 | 0.3 |
| 1 AM 12/16 | 1.2 | 0.3 |
| 7 AM 12/16 | 1.2 | 0.3 |
| 1 PM 12/16 | 1.2 | 0.3 |
| 7 PM 12/16 | 1.2 | 0.3 |
| 1 AM 12/17 | 1.2 | 0.3 |
| 7 AM 12/17 | 1.2 | 0.3 |
| Time | Stage (ft) | Flow (kcfs) |
|---|---|---|
| 9:45 PM 12/14 | 1.22 | 0.318 |
| 9:30 PM 12/14 | 1.23 | 0.327 |
| 9:15 PM 12/14 | 1.23 | 0.327 |
| 9:00 PM 12/14 | 1.23 | 0.327 |
| 8:45 PM 12/14 | 1.23 | 0.327 |
| 8:30 PM 12/14 | 1.23 | 0.327 |
| 8:15 PM 12/14 | 1.22 | 0.318 |
| 8:00 PM 12/14 | 1.22 | 0.318 |
| 7:45 PM 12/14 | 1.22 | 0.318 |
| 7:30 PM 12/14 | 1.22 | 0.318 |
| 7:15 PM 12/14 | 1.22 | 0.318 |
| 7:00 PM 12/14 | 1.21 | 0.309 |
| 6:45 PM 12/14 | 1.21 | 0.309 |
| 6:30 PM 12/14 | 1.21 | 0.309 |
| 6:15 PM 12/14 | 1.21 | 0.309 |
| 6:00 PM 12/14 | 1.21 | 0.309 |
| 5:45 PM 12/14 | 1.2 | 0.3 |
| 5:30 PM 12/14 | 1.2 | 0.3 |
| 5:15 PM 12/14 | 1.2 | 0.3 |
| 5:00 PM 12/14 | 1.2 | 0.3 |
| 4:45 PM 12/14 | 1.2 | 0.3 |
| 4:30 PM 12/14 | 1.2 | 0.3 |
| 4:15 PM 12/14 | 1.2 | 0.3 |
| 4:00 PM 12/14 | 1.2 | 0.3 |
| 3:45 PM 12/14 | 1.2 | 0.3 |
| 3:30 PM 12/14 | 1.2 | 0.3 |
| 3:15 PM 12/14 | 1.2 | 0.3 |
| 3:00 PM 12/14 | 1.2 | 0.3 |
| 2:45 PM 12/14 | 1.2 | 0.3 |
| 2:30 PM 12/14 | 1.2 | 0.3 |
17.46' -
Record flood with Tropical Storm Irene in August 2011. Widespread flooding in the region. Water reaches the Mill Point bridge.
10' -
Major flood stage.
8' -
Moderate flood stage. Water reaches homes in Lost Valley along Island Road.
7' -
Water reaches Priddle Camp Road.
6' -
Minor flood stage. Water reaches lowest houses in Burtonsville.
5' -
The river is nearly bankfull and portions of Island Road in the Lost Valley community are inundated.
4.5' -
Action stage. Water reaches Island Road in the Lost Valley community.
| Date | Stage (ft) |
|---|---|
| Aug 29, 2011 | 17.46 |
| Jan 20, 1996 | 12.88 |
| Oct 16, 1955 | 12.39 |
| Apr 5, 1987 | 11.23 |
| Mar 19, 1936 | 10.5 |
| Apr 3, 2005 | 10.3 |
| Sep 22, 1938 | 10.2 |
| Mar 22, 1980 | 10.15 |
| Mar 21, 1901 | 9.6 |
| Sep 8, 2011 | 9.33 |
| Apr 17, 2007 | 8.95 |
| Dec 26, 2020 | 8.67 |
| Mar 27, 1913 | 8.55 |
| Nov 9, 1977 | 8.51 |
| Oct 27, 2021 | 8.48 |
| Mar 23, 2010 | 8.48 |
| Apr 6, 1984 | 8.38 |
| Oct 17, 1977 | 8.33 |
| Mar 15, 1986 | 8.14 |
| Mar 31, 1951 | 8 |
Data provided by the National Weather Service.