Prairie Dog Town Fork of the Red River at Childress 10N
Critical Stages
10' - Action
10' - Flood
14' - Moderate
20' - Major
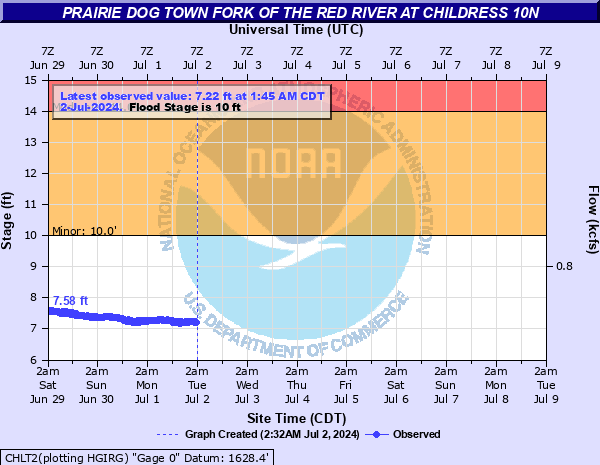
Latest Observation
Updated: 4:45 AM CST 12/16/25
Status: No Flooding
Stage: 7.22 ft
Flow: 0.0013 kcfs
Forecast
Forecast not available for this location.
| Time | Stage (ft) | Flow (kcfs) |
|---|---|---|
| 4:45 AM 12/16 | 7.22 | 0.0013 |
| 4:30 AM 12/16 | 7.22 | 0.0013 |
| 4:15 AM 12/16 | 7.22 | 0.0013 |
| 4:00 AM 12/16 | 7.22 | 0.0013 |
| 3:45 AM 12/16 | 7.22 | 0.0013 |
| 3:30 AM 12/16 | 7.22 | 0.0013 |
| 3:15 AM 12/16 | 7.22 | 0.0013 |
| 3:00 AM 12/16 | 7.22 | 0.0013 |
| 2:45 AM 12/16 | 7.22 | 0.0013 |
| 2:30 AM 12/16 | 7.22 | 0.0013 |
| 2:15 AM 12/16 | 7.22 | 0.0013 |
| 2:00 AM 12/16 | 7.22 | 0.0013 |
| 1:45 AM 12/16 | 7.21 | 0.0011 |
| 1:30 AM 12/16 | 7.22 | 0.0013 |
| 1:15 AM 12/16 | 7.22 | 0.0013 |
| 1:00 AM 12/16 | 7.22 | 0.0013 |
| 12:45 AM 12/16 | 7.22 | 0.0013 |
| 12:30 AM 12/16 | 7.22 | 0.0013 |
| 12:15 AM 12/16 | 7.21 | 0.0011 |
| 12:00 AM 12/16 | 7.21 | 0.0011 |
| 11:45 PM 12/15 | 7.22 | 0.0013 |
| 11:30 PM 12/15 | 7.22 | 0.0013 |
| 11:15 PM 12/15 | 7.21 | 0.0011 |
| 11:00 PM 12/15 | 7.21 | 0.0011 |
| 10:45 PM 12/15 | 7.21 | 0.0011 |
| 10:30 PM 12/15 | 7.22 | 0.0013 |
| 10:15 PM 12/15 | 7.22 | 0.0013 |
| 10:00 PM 12/15 | 7.22 | 0.0013 |
| 9:45 PM 12/15 | 7.22 | 0.0013 |
| 9:30 PM 12/15 | 7.21 | 0.0011 |
27' -
U.S. 83 highway bridge will have water against it and south approache will be flooded.
25' -
Extensive areas of farm and ranch land will be inundated. The water will begin to flood the south approach to U.S. 83 bridge and will be up to the I-beams supporting the bridge.
21' -
Moderate flooding of farm and ranch land will occur.
17' -
The river is near its record stage of 16.9 feet. Moderate flooding of farm and ranch land will occur. The water remains 8 feet under the U.S. 83 highway bridge. Cattle losses are possible.
14' -
Moderate flooding of farm and ranch land occurs. Losses to cattle are possible and damage to fences is likley.
13' -
Minor flooding of farm and ranch land will occur. Cattle in the flood plain are threatened. The water flowing in the river will be over 1/2 mile wide.
10' -
Cattle grazing in the flood plain are threatened by rising water.
| Date | Stage (ft) |
|---|---|
| Jun 1, 1957 | 16.9 |
| May 21, 1977 | 13.94 |
| Jan 1, 1978 | 13.47 |
| Oct 3, 1986 | 12.1 |
| Jun 26, 1965 | 12 |
| Jun 4, 1995 | 11.6 |
| Oct 5, 2017 | 11.42 |
| Jul 9, 2015 | 11.39 |
| Jul 2, 2021 | 11.33 |
| Aug 31, 1986 | 11.2 |
| Aug 29, 1968 | 11.1 |
| Oct 31, 1998 | 11.06 |
| Jun 20, 2019 | 10.99 |
| Mar 29, 1992 | 10.9 |
| May 4, 2001 | 10.88 |
| May 30, 1990 | 10.74 |
| Jun 13, 1989 | 10.7 |
| Jun 12, 2005 | 10.69 |
| Aug 27, 1996 | 10.41 |
| Jun 5, 1985 | 10.4 |
Data provided by the National Weather Service.