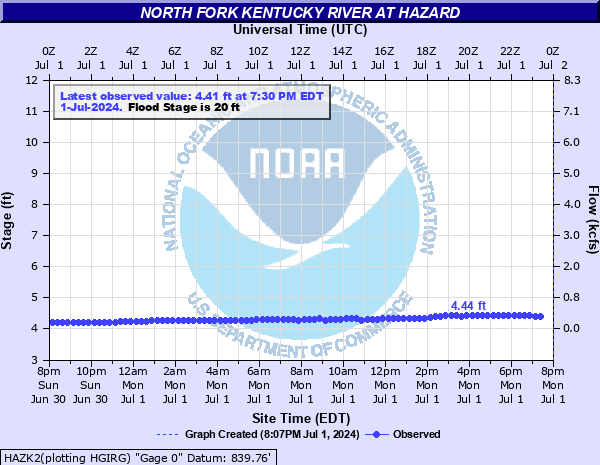
North Fork Kentucky River at Hazard
Critical Stages
16' - Action
20' - Flood
27' - Moderate
33' - Major
Latest Observation
Updated: 10:15 PM EST 12/14/25
Status: No Flooding
Stage: 4.56 ft
Flow: 0.32 kcfs
Forecast
Forecast not available for this location.
| Time | Stage (ft) | Flow (kcfs) |
|---|---|---|
| 10:15 PM 12/14 | 4.56 | 0.32 |
| 10:00 PM 12/14 | 4.56 | 0.32 |
| 9:45 PM 12/14 | 4.56 | 0.32 |
| 9:30 PM 12/14 | 4.56 | 0.32 |
| 9:15 PM 12/14 | 4.56 | 0.32 |
| 9:00 PM 12/14 | 4.56 | 0.32 |
| 8:45 PM 12/14 | 4.56 | 0.32 |
| 5:45 PM 12/14 | 4.54 | 0.302 |
| 5:30 PM 12/14 | 4.54 | 0.302 |
| 5:15 PM 12/14 | 4.56 | 0.32 |
| 5:00 PM 12/14 | 4.52 | 0.286 |
| 4:45 PM 12/14 | 4.55 | 0.311 |
| 4:30 PM 12/14 | 4.52 | 0.286 |
| 4:15 PM 12/14 | 4.52 | 0.286 |
| 4:00 PM 12/14 | 4.53 | 0.294 |
| 3:45 PM 12/14 | 4.54 | 0.302 |
| 3:30 PM 12/14 | 4.53 | 0.294 |
| 3:15 PM 12/14 | 4.53 | 0.294 |
| 3:00 PM 12/14 | 4.53 | 0.294 |
| 2:45 PM 12/14 | 4.53 | 0.294 |
| 2:30 PM 12/14 | 4.52 | 0.286 |
| 2:15 PM 12/14 | 4.53 | 0.294 |
| 2:00 PM 12/14 | 4.54 | 0.302 |
| 1:45 PM 12/14 | 4.55 | 0.311 |
| 1:30 PM 12/14 | 4.54 | 0.302 |
| 1:15 PM 12/14 | 4.53 | 0.294 |
| 1:00 PM 12/14 | 4.51 | 0.278 |
| 12:45 PM 12/14 | 4.53 | 0.294 |
| 12:30 PM 12/14 | 4.53 | 0.294 |
| 12:15 PM 12/14 | 4.53 | 0.294 |
37.5' -
Flooding will exceed highest stage on record. Most of Hazard is covered. Water is four feet deep in some sections of business district.
34.6' -
Main street is flooded in front of the First National Bank building.
33' -
Major flooding occurs. Much of the business district is covered.
29.4' -
Flooding reaches the front of the old railroad station.
28.5' -
Flood waters cover the foot of the Depot bridge.
27' -
Moderate flooding occurs. The lower part of the business district is affected.
25' -
Flooding begins in some basements.
20' -
Low lying areas flood. The street at the mouth of Big Bottom Branch is flooded.
| Date | Stage (ft) |
|---|---|
| Jan 29, 1957 | 37.54 |
| Jan 1, 1912 | 36.3 |
| Mar 12, 1963 | 35 |
| May 30, 1927 | 34 |
| May 7, 1984 | 32.12 |
| Apr 5, 1977 | 32.06 |
| Feb 16, 2025 | 30.52 |
| Feb 3, 1939 | 29.95 |
| Mar 7, 1967 | 29.85 |
| Oct 17, 1989 | 27.35 |
| Feb 1, 1951 | 27.2 |
| Jun 22, 1974 | 26.94 |
| Feb 16, 2003 | 26.94 |
| Jan 8, 1946 | 26.55 |
| Aug 5, 1947 | 25.94 |
| Feb 7, 2020 | 25.8 |
| Apr 19, 1998 | 25.47 |
| Mar 4, 1997 | 25.14 |
| Mar 1, 2021 | 25.01 |
| May 7, 1971 | 24.91 |
Data provided by the National Weather Service.