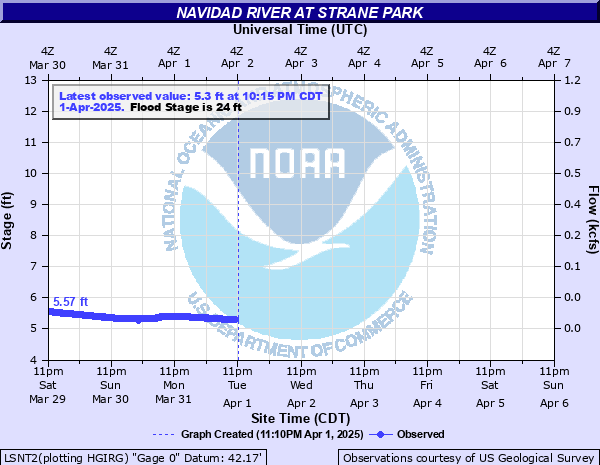
Navidad River at Strane Park
Critical Stages
13' - Action
24' - Flood
26' - Moderate
29' - Major
Latest Observation
Updated: 10:15 PM CST 12/14/25
Status: No Flooding
Stage: 4.5 ft
Flow: -999 kcfs
Forecast
Forecast not available for this location.
| Time | Stage (ft) | Flow (kcfs) |
|---|---|---|
| 10:15 PM 12/14 | 4.5 | -999 |
| 10:00 PM 12/14 | 4.5 | -999 |
| 9:45 PM 12/14 | 4.5 | -999 |
| 9:30 PM 12/14 | 4.5 | -999 |
| 9:15 PM 12/14 | 4.5 | -999 |
| 9:00 PM 12/14 | 4.51 | -999 |
| 8:45 PM 12/14 | 4.52 | -999 |
| 8:30 PM 12/14 | 4.55 | -999 |
| 8:15 PM 12/14 | 4.54 | -999 |
| 8:00 PM 12/14 | 4.51 | -999 |
| 7:45 PM 12/14 | 4.53 | -999 |
| 7:30 PM 12/14 | 4.52 | -999 |
| 7:15 PM 12/14 | 4.53 | -999 |
| 7:00 PM 12/14 | 4.53 | -999 |
| 6:45 PM 12/14 | 4.53 | -999 |
| 6:30 PM 12/14 | 4.53 | -999 |
| 6:15 PM 12/14 | 4.52 | -999 |
| 6:00 PM 12/14 | 4.51 | -999 |
| 5:45 PM 12/14 | 4.5 | -999 |
| 5:30 PM 12/14 | 4.5 | -999 |
| 5:15 PM 12/14 | 4.49 | -999 |
| 5:00 PM 12/14 | 4.49 | -999 |
| 4:45 PM 12/14 | 4.45 | -999 |
| 4:30 PM 12/14 | 4.47 | -999 |
| 4:15 PM 12/14 | 4.46 | -999 |
| 4:00 PM 12/14 | 4.44 | -999 |
| 3:45 PM 12/14 | 4.46 | -999 |
| 3:30 PM 12/14 | 4.46 | -999 |
| 3:15 PM 12/14 | 4.52 | -999 |
| 3:00 PM 12/14 | 4.5 | -999 |
29' -
Major lowland flooding begins with the river close to one third of a miles wide in the vicinity of the gage. County Road 401 is inundated and closed. Lowest homes in the floodplain are threatened. Livestock can be cut off in low-lying parts of the floodplain.
26' -
Moderate lowland flooding begins threatening livestock and property in the river channel. The right approach of the County Road 401 bridge is closed making travel difficult.
24' -
Minor lowland flooding begins with water well into the floodplain and threatening the west approach of the bridge at County Road 401.
17' -
Flows exceed low-lying areas of the floodplain with no significant damage.
13' -
Flows exceed low-lying areas of both banks.
| Date | Stage (ft) |
|---|---|
| Aug 29, 2017 | 31.28 |
| Oct 19, 1998 | 30.08 |
| Nov 24, 2004 | 29.45 |
| Jun 18, 2015 | 29.02 |
| Nov 7, 2002 | 28.23 |
| Jun 22, 1997 | 27.89 |
| Apr 20, 2009 | 27.77 |
| Apr 21, 2016 | 27.73 |
| Jul 3, 2007 | 27.33 |
| Oct 18, 2007 | 27.32 |
| Oct 16, 1997 | 27.25 |
| Sep 1, 2001 | 27.06 |
| Jul 11, 2021 | 27.05 |
| May 30, 2007 | 27.01 |
| Apr 19, 2015 | 26.23 |
| Jun 27, 2004 | 26.12 |
| May 2, 2007 | 25.72 |
| Oct 5, 2009 | 25.7 |
| Dec 11, 2018 | 25.69 |
| Mar 15, 2007 | 25.66 |
Data provided by the National Weather Service.