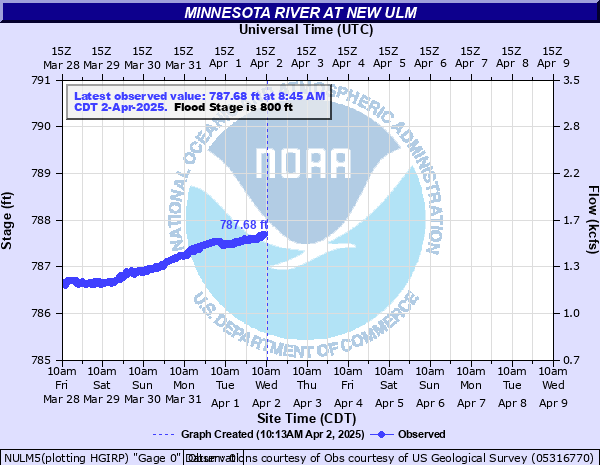
Minnesota River at New Ulm
Critical Stages
796' - Action
800' - Flood
804' - Moderate
806' - Major
Latest Observation
Updated: 10:45 PM CST 12/14/25
Status: No Flooding
Stage: 788.11 ft
Flow: 1.79 kcfs
Forecast
Forecast not available for this location.
| Time | Stage (ft) | Flow (kcfs) |
|---|---|---|
| 11:45 PM 12/14 | 788.13 | 1.8 |
| 11:30 PM 12/14 | 788.12 | 1.8 |
| 11:15 PM 12/14 | 788.12 | 1.8 |
| 11:00 PM 12/14 | 788.12 | 1.8 |
| 10:45 PM 12/14 | 788.11 | 1.79 |
| 10:30 PM 12/14 | 788.1 | 1.79 |
| 10:15 PM 12/14 | 788.1 | 1.79 |
| 10:00 PM 12/14 | 788.1 | 1.79 |
| 9:45 PM 12/14 | 788.09 | 1.79 |
| 9:30 PM 12/14 | 788.09 | 1.79 |
| 9:15 PM 12/14 | 788.08 | 1.78 |
| 9:00 PM 12/14 | 788.07 | 1.78 |
| 8:45 PM 12/14 | 788.07 | 1.78 |
| 8:30 PM 12/14 | 788.06 | 1.77 |
| 8:15 PM 12/14 | 788.06 | 1.77 |
| 8:00 PM 12/14 | 788.06 | 1.77 |
| 7:45 PM 12/14 | 788.05 | 1.77 |
| 7:30 PM 12/14 | 788.05 | 1.77 |
| 7:15 PM 12/14 | 788.04 | 1.76 |
| 7:00 PM 12/14 | 788.04 | 1.76 |
| 6:45 PM 12/14 | 788.04 | 1.76 |
| 6:30 PM 12/14 | 788.03 | 1.76 |
| 6:15 PM 12/14 | 788.03 | 1.76 |
| 6:00 PM 12/14 | 788.03 | 1.76 |
| 5:45 PM 12/14 | 788.03 | 1.76 |
| 5:30 PM 12/14 | 788.03 | 1.76 |
| 5:15 PM 12/14 | 788.03 | 1.76 |
| 5:00 PM 12/14 | 788.03 | 1.76 |
| 4:45 PM 12/14 | 788.04 | 1.76 |
| 4:30 PM 12/14 | 788.04 | 1.76 |
810.25' -
Flood waters begin to impact Highway 37.
806.5' -
Flood waters begin to impact Nicollet County CSAH 21 between MN Hwy 15 and 4.
805' -
Flood gate on South Front Street is closed.
804' -
Flood waters begin to impact Brown County CSAH 13 near Buessmann Bridge.
803' -
Flood gate at C Street is closed.
801' -
Flood gate at 18th South Street is closed.
796' -
Water impacts park land and boat launch access road is closed.
795' -
Water begins to impact the access roads in the floodplain.
| Date | Stage (ft) |
|---|---|
| Apr 9, 1997 | 811.03 |
| Apr 15, 1969 | 809.44 |
| Apr 16, 2001 | 808.3 |
| Apr 26, 2001 | 807.7 |
| Apr 2, 2019 | 807.55 |
| Apr 5, 2011 | 806.02 |
| Apr 22, 2023 | 805.37 |
| Mar 27, 2010 | 804.86 |
| Apr 21, 2019 | 804.78 |
| Jul 7, 2018 | 804.58 |
| Sep 29, 2010 | 804.2 |
| Jun 25, 2024 | 803.4 |
| May 18, 2022 | 802.39 |
| May 30, 2019 | 801.72 |
| May 17, 2023 | 801.46 |
| Apr 26, 2018 | 801.37 |
| Jul 4, 2019 | 800.2 |
| Apr 4, 2009 | 799.79 |
| Oct 9, 2017 | 799.78 |
| Jun 9, 1972 | 799.44 |
Data provided by the National Weather Service.