St. Joseph River (MI/IN) at Burlington
Critical Stages
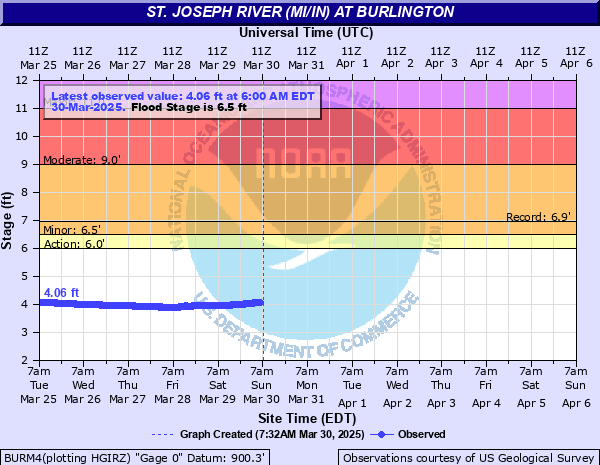
6' - Action
6.5' - Flood
9' - Moderate
11' - Major
Latest Observation
Updated: 11:00 PM EST 12/4/25
Status: No Flooding
Stage: 3.28 ft
Flow: 0.0767 kcfs
Forecast
Forecast not available for this location.
| Time | Stage (ft) | Flow (kcfs) |
|---|---|---|
| 11:00 PM 12/4 | 3.28 | 0.0767 |
| 10:45 PM 12/4 | 3.28 | 0.0767 |
| 10:30 PM 12/4 | 3.28 | 0.0767 |
| 10:15 PM 12/4 | 3.28 | 0.0767 |
| 10:00 PM 12/4 | 3.28 | 0.0767 |
| 9:45 PM 12/4 | 3.28 | 0.0767 |
| 9:30 PM 12/4 | 3.28 | 0.0767 |
| 9:15 PM 12/4 | 3.29 | 0.0778 |
| 9:00 PM 12/4 | 3.29 | 0.0778 |
| 8:45 PM 12/4 | 3.29 | 0.0778 |
| 8:30 PM 12/4 | 3.31 | 0.0801 |
| 8:15 PM 12/4 | 3.32 | 0.0811 |
| 8:00 PM 12/4 | 3.33 | 0.0822 |
| 7:45 PM 12/4 | 3.35 | 0.0844 |
| 7:30 PM 12/4 | 3.37 | 0.0866 |
| 7:15 PM 12/4 | 3.39 | 0.0888 |
| 7:00 PM 12/4 | 3.39 | 0.0888 |
| 6:45 PM 12/4 | 3.4 | 0.09 |
| 6:30 PM 12/4 | 3.39 | 0.0888 |
| 6:15 PM 12/4 | 3.38 | 0.0877 |
| 6:00 PM 12/4 | 3.36 | 0.0855 |
| 5:45 PM 12/4 | 3.35 | 0.0844 |
| 5:30 PM 12/4 | 3.34 | 0.0833 |
| 5:15 PM 12/4 | 3.33 | 0.0822 |
| 5:00 PM 12/4 | 3.33 | 0.0822 |
| 4:45 PM 12/4 | 3.33 | 0.0822 |
| 4:30 PM 12/4 | 3.33 | 0.0822 |
| 4:15 PM 12/4 | 3.32 | 0.0811 |
| 4:00 PM 12/4 | 3.32 | 0.0811 |
| 3:45 PM 12/4 | 3.32 | 0.0811 |
11' -
Expect major flooding of homes in Burlington along Saint Joe Street.
9' -
Expect moderate flooding of homes in Burlington along Saint Joe Street.
6.5' -
Expect minor flooding of crawl spaces to homes adjacent to the river upstream.
6' -
River is bankfull, minor overflow into low lying wooded areas along the river begins.
| Date | Stage (ft) |
|---|---|
| Feb 22, 2018 | 6.93 |
| Sep 16, 2008 | 6.83 |
| Feb 14, 2008 | 6.78 |
| May 19, 2020 | 6.7 |
| Feb 11, 2001 | 6.64 |
| Apr 24, 2013 | 6.51 |
| Jul 12, 2024 | 6.5 |
| Mar 11, 2009 | 6.5 |
| Feb 24, 2022 | 6.41 |
| Feb 10, 2001 | 6.33 |
| Apr 7, 2017 | 6.27 |
| Jan 5, 1993 | 6.21 |
| Dec 6, 2011 | 6.17 |
| Feb 28, 1997 | 6.16 |
| May 31, 2011 | 6.13 |
| May 23, 2010 | 6.08 |
| May 8, 2019 | 6.07 |
| Mar 22, 2014 | 6.07 |
| Jan 14, 2005 | 6.04 |
| Jun 16, 2015 | 6.03 |
Data provided by the National Weather Service.