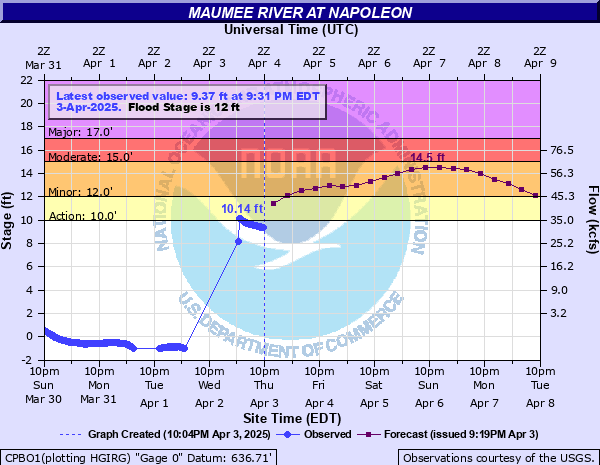
Maumee River at Napoleon
Critical Stages
10' - Action
12' - Flood
15' - Moderate
17' - Major
Latest Observation
Updated: 12:02 AM EST 12/5/25
Status: No Flooding
Stage: 1.13 ft
Flow: 0.533 kcfs
Forecast
Forecast not available for this location.
| Time | Stage (ft) | Flow (kcfs) |
|---|---|---|
| 12:02 AM 12/5 | 1.13 | 0.533 |
| 11:47 PM 12/4 | 1.13 | 0.533 |
| 11:15 PM 12/4 | 1.13 | 0.533 |
| 11:01 PM 12/4 | 1.13 | 0.533 |
| 11:00 PM 12/4 | 1.13 | 0.533 |
| 10:47 PM 12/4 | 1.13 | 0.533 |
| 10:45 PM 12/4 | 1.13 | 0.533 |
| 10:32 PM 12/4 | 1.13 | 0.533 |
| 10:30 PM 12/4 | 1.13 | 0.533 |
| 10:17 PM 12/4 | 1.13 | 0.533 |
| 10:15 PM 12/4 | 1.13 | 0.533 |
| 10:01 PM 12/4 | 1.13 | 0.533 |
| 10:00 PM 12/4 | 1.13 | 0.533 |
| 9:47 PM 12/4 | 1.13 | 0.533 |
| 9:45 PM 12/4 | 1.13 | 0.533 |
| 9:31 PM 12/4 | 1.13 | 0.533 |
| 9:30 PM 12/4 | 1.13 | 0.533 |
| 9:16 PM 12/4 | 1.13 | 0.533 |
| 9:15 PM 12/4 | 1.13 | 0.533 |
| 9:01 PM 12/4 | 1.13 | 0.533 |
| 9:00 PM 12/4 | 1.13 | 0.533 |
| 8:45 PM 12/4 | 1.13 | 0.533 |
| 8:32 PM 12/4 | 1.13 | 0.533 |
| 8:30 PM 12/4 | 1.13 | 0.533 |
| 8:15 PM 12/4 | 1.13 | 0.533 |
| 8:01 PM 12/4 | 1.14 | 0.544 |
| 8:00 PM 12/4 | 1.14 | 0.544 |
| 7:47 PM 12/4 | 1.14 | 0.544 |
| 7:45 PM 12/4 | 1.14 | 0.544 |
| 7:31 PM 12/4 | 1.13 | 0.533 |
27' -
Record flooding is underway throughout the eastern sections of Napoleon and all along the tributaries flowing into the Maumee River.
20' -
Flood water begins to threaten residents along the following streets: Fairview, Oak, Walnut, First, Second and from Route 8 to Maumee Street. Serious backwater flooding occurs along all tributaries.
17' -
Massive flooding will occur. Residents living along the Maumee and its tributaries should prepare for extensive flood losses.
15' -
Flood water will threaten some buildings in the east end of Napoleon and cause several roads to become impassible.
12.5' -
Recreational campgrounds near Napoleon begin to flood.
12' -
Flooding of farm land and possibly some secondary roads near the river begins.
| Date | Stage (ft) |
|---|---|
| Mar 27, 1913 | 25 |
| Feb 11, 1959 | 19.5 |
| Feb 14, 1918 | 19.5 |
| Mar 2, 1910 | 18.8 |
| Mar 20, 1912 | 18 |
| Mar 15, 1982 | 17.54 |
| Jan 1, 1991 | 17.13 |
| Mar 11, 2009 | 16.7 |
| Jan 14, 2005 | 16.65 |
| Dec 31, 1990 | 16.58 |
| Jun 29, 2015 | 16.26 |
| Feb 16, 1950 | 16 |
| Feb 26, 1985 | 15.99 |
| Dec 1, 2011 | 15.5 |
| May 27, 2011 | 15.4 |
| Mar 15, 2003 | 14.45 |
| Jun 16, 1981 | 13.94 |
| May 11, 2003 | 13.05 |
| Jun 15, 2004 | 12.8 |
| Jan 16, 2007 | 12.69 |
Data provided by the National Weather Service.