St. Joseph River (OH/IN) at Montpelier
Critical Stages
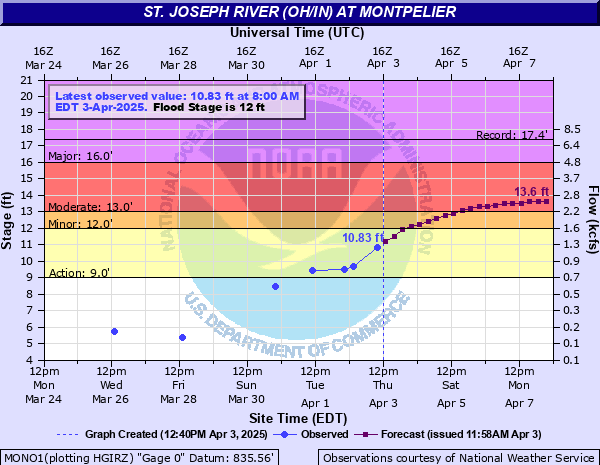
9' - Action
12' - Flood
13' - Moderate
16' - Major
Latest Observation
Updated: 7:03 PM LMT 12/31/00
Status: Obs Not Current
Stage: -999 ft
Flow: -999 kcfs
Forecast
Forecast not available for this location.
| Time | Stage (ft) | Flow (kcfs) |
|---|---|---|
| 10:00 AM 12/3 | 4.1 | 0.084 |
| 10:00 AM 11/26 | 4.19 | 0.0876 |
| 8:30 AM 11/24 | 4.05 | 0.0804 |
| 9:00 AM 11/21 | 4.05 | 0.0804 |
| 10:00 AM 11/17 | 4.08 | 0.0826 |
| 9:00 AM 11/12 | 4.03 | 0.0791 |
| 10:00 AM 11/10 | 4.04 | 0.0797 |
18.5' -
This is a very dangerous situation. The entire village of Montpelier can expect 2 to 3 feet of water. Areas outside Montpelier will be totally inundated.
18' -
Montpelier is flooded by 1 to 2 feet of water and outlying farm buildings are totally inundated.
17.5' -
Flood waters will overtop the dikes in Montpelier. Homes and businesses along Opdyke, Moore, and Madison will be affected.
16.5' -
Flood waters will approach the top of the Montpelier Dikes with several roads becoming impassible. Water begins to hit the bottom of the bridge at the gage site.
15' -
Several roadways are closed including County Road 10 at County Road K.
14' -
County Road K, one mile southwest of Montpelier is flooded. Flood waters affect the southeast side of Pioneer and cover large areas of low land and agricultural land near the river.
13' -
County Road K, one mile southwest of Montpelier begins to flood. Some flooding begins to affect the village of Pioneer. Significant low land and agricultural flooding occurs near the river.
12' -
Flooding of low land and agricultural land begins near the river.
| Date | Stage (ft) |
|---|---|
| Feb 25, 1985 | 17.4 |
| Dec 31, 1990 | 17 |
| Feb 2, 1982 | 16.2 |
| Jan 1, 1991 | 16.1 |
| Apr 5, 1950 | 16 |
| Jun 2, 1989 | 16 |
| Feb 22, 2018 | 15.9 |
| May 23, 2010 | 15.53 |
| Dec 1, 2011 | 15.51 |
| May 20, 2020 | 15.45 |
| Mar 12, 2009 | 15.14 |
| May 13, 2002 | 15.13 |
| Feb 15, 1984 | 15.1 |
| May 3, 2019 | 14.76 |
| Feb 11, 2001 | 14.61 |
| Jan 25, 1999 | 14.61 |
| Jan 10, 2008 | 14.5 |
| Jul 11, 1951 | 14.5 |
| Feb 7, 2008 | 14.41 |
| May 18, 1945 | 14.3 |
Data provided by the National Weather Service.