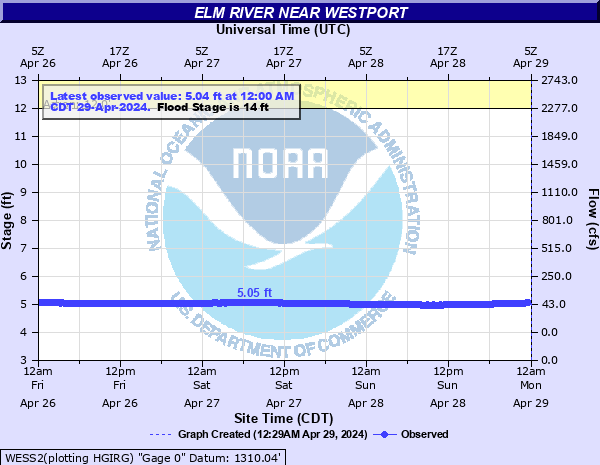
Elm River near Westport
Critical Stages
12' - Action
14' - Flood
16' - Moderate
19' - Major
Latest Observation
Updated: 1:00 AM CST 12/16/25
Status: No Flooding
Stage: 4.34 ft
Flow: -999 kcfs
Forecast
Forecast not available for this location.
| Time | Stage (ft) | Flow (kcfs) |
|---|---|---|
| 1:00 AM 12/16 | 4.34 | -999 |
| 12:45 AM 12/16 | 4.35 | -999 |
| 12:30 AM 12/16 | 4.35 | -999 |
| 12:15 AM 12/16 | 4.34 | -999 |
| 12:00 AM 12/16 | 4.35 | -999 |
| 11:45 PM 12/15 | 4.34 | -999 |
| 11:30 PM 12/15 | 4.34 | -999 |
| 11:15 PM 12/15 | 4.34 | -999 |
| 11:00 PM 12/15 | 4.34 | -999 |
| 10:45 PM 12/15 | 4.34 | -999 |
| 10:30 PM 12/15 | 4.34 | -999 |
| 10:15 PM 12/15 | 4.34 | -999 |
| 10:00 PM 12/15 | 4.34 | -999 |
| 9:45 PM 12/15 | 4.34 | -999 |
| 9:30 PM 12/15 | 4.34 | -999 |
| 9:15 PM 12/15 | 4.34 | -999 |
| 9:00 PM 12/15 | 4.34 | -999 |
| 8:45 PM 12/15 | 4.34 | -999 |
| 8:30 PM 12/15 | 4.34 | -999 |
| 8:15 PM 12/15 | 4.34 | -999 |
| 8:00 PM 12/15 | 4.34 | -999 |
| 7:45 PM 12/15 | 4.34 | -999 |
| 7:30 PM 12/15 | 4.34 | -999 |
| 7:15 PM 12/15 | 4.34 | -999 |
| 7:00 PM 12/15 | 4.35 | -999 |
| 6:45 PM 12/15 | 4.34 | -999 |
| 6:30 PM 12/15 | 4.34 | -999 |
| 6:15 PM 12/15 | 4.35 | -999 |
| 6:00 PM 12/15 | 4.35 | -999 |
| 5:45 PM 12/15 | 4.35 | -999 |
22.5' -
The bridge 2 miles south and 1 mile east of Westport will be overtopped
22' -
Large portions of Westport will have water 2 to 3 feet deep
21' -
The bridge on Brown County Road 10a is overtopped
20.5' -
The water will reach the bottom of the bridge 2 miles south and 1 mile east of Westport. The bridge east of Westport will be overtopped
19' -
The community of Westport begins to flood
18.5' -
The water will reach the bottom of the bridge east of Westport
17.5' -
Water reaches the bottom of the bridge north of Westport
16' -
Several gravel roads along the river begin to flood
14.5' -
The bridge northwest of Kruse Dam will be overtopped
14' -
The county road east of Westport becomes impassable
12.5' -
The water will reach the bottom of the bridge north of Kruse Dam
| Date | Stage (ft) |
|---|---|
| Mar 25, 2009 | 22.63 |
| Apr 10, 1969 | 22.11 |
| Mar 30, 1997 | 21.56 |
| Apr 4, 2019 | 20.8 |
| Jul 27, 2020 | 20.45 |
| Apr 8, 1952 | 20.1 |
| Mar 21, 2010 | 19.78 |
| Jun 11, 2005 | 17.78 |
| Mar 16, 1995 | 17.71 |
| Jun 24, 2011 | 17.47 |
| Mar 17, 1966 | 17.4 |
| Mar 27, 1978 | 17.2 |
| Apr 19, 2023 | 16.75 |
| Apr 3, 1982 | 16.24 |
| Mar 19, 1972 | 15.86 |
| May 14, 1999 | 15.82 |
| Mar 17, 1996 | 15.4 |
| Mar 28, 1989 | 15.02 |
| Jun 23, 1975 | 14.79 |
| May 4, 2022 | 14.39 |
Data provided by the National Weather Service.