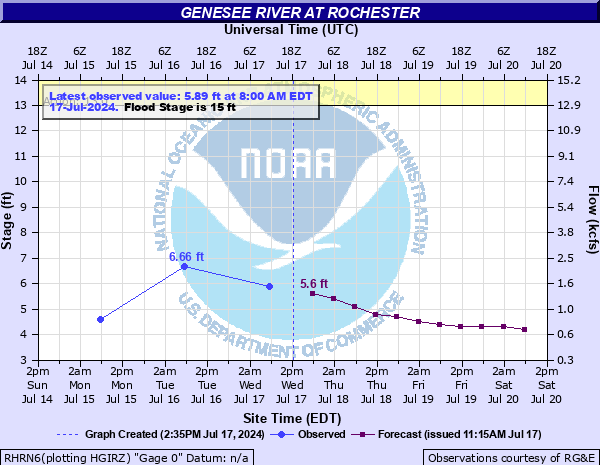
Genesee River at Rochester
Critical Stages
13' - Action
15' - Flood
19' - Moderate
24' - Major
Latest Observation
Updated: 7:00 AM EST 12/6/25
Status: No Flooding
Stage: 4.48 ft
Flow: 0.744 kcfs
Forecast
| Time | Stage (ft) | Flow (kcfs) |
|---|---|---|
| 1 PM 12/6 | 4.4 | 0.709 |
| 7 PM 12/6 | 4.4 | 0.709 |
| 1 AM 12/7 | 4.4 | 0.709 |
| 7 AM 12/7 | 4.4 | 0.709 |
| 1 PM 12/7 | 4.3 | 0.668 |
| 7 PM 12/7 | 4.3 | 0.668 |
| 1 AM 12/8 | 4.3 | 0.668 |
| 7 AM 12/8 | 4.3 | 0.668 |
| Time | Stage (ft) | Flow (kcfs) |
|---|---|---|
| 7:00 AM 12/6 | 4.48 | 0.744 |
| 7:00 AM 12/5 | 4.6 | 0.797 |
| 7:00 AM 12/4 | 4.81 | 0.895 |
| 7:00 AM 12/3 | 5.21 | 1.11 |
| 7:00 AM 12/2 | 5.06 | 1.02 |
| 7:00 AM 12/1 | 5.31 | 1.17 |
| 7:00 AM 11/30 | 5.55 | 1.32 |
| 7:00 AM 11/29 | 5.23 | 1.12 |
| 7:00 AM 11/28 | 4.88 | 0.93 |
| 7:00 AM 11/27 | 4.72 | 0.852 |
| 7:00 AM 11/26 | 5.51 | 1.29 |
| 7:00 AM 11/25 | 5.01 | 0.996 |
| 7:00 AM 11/24 | 4.63 | 0.81 |
| 7:00 AM 11/23 | 4.73 | 0.857 |
| 7:00 AM 11/22 | 4.91 | 0.945 |
| 7:00 AM 11/21 | 5.5 | 1.29 |
| 7:00 AM 11/20 | 6.02 | 1.65 |
| 7:00 AM 11/19 | 6.31 | 1.89 |
| 7:00 AM 11/18 | 6.39 | 1.96 |
| 7:00 AM 11/17 | 5.42 | 1.24 |
| 7:00 AM 11/16 | 5.2 | 1.1 |
| 7:00 AM 11/15 | 4.42 | 0.718 |
| 7:00 AM 11/14 | 4.57 | 0.783 |
| 7:00 AM 11/13 | 4.47 | 0.739 |
| 7:00 AM 11/12 | 4.36 | 0.693 |
| 7:00 AM 11/11 | 4.81 | 0.895 |
| 7:00 AM 11/10 | 4.79 | 0.886 |
| 7:00 AM 11/9 | 4.39 | 0.705 |
| 7:00 AM 11/8 | 4.45 | 0.731 |
| 7:00 AM 11/7 | 3.98 | 0.548 |
24' -
Major flood, Rochester flood walls topped. Major and extensive flooding with damages in residential and commercial areas south of downtown and south suburbs. Evacuations possible. Flow = 55000 cfs.
23' -
Canal locks topped at 23 feet
19' -
Moderate flood, more widespread flooding southern suburbs. Areas above upper falls start to flood, including Bausch and Lomb and Barnard Simmons Plants. Flow 33000 cfs.
15' -
Flood stage, minor flood, some residential flooding begins in southern suburbs, mile 12-18 in Henrietta and Chili. Flow 20000 cfs.
| Date | Stage (ft) |
|---|---|
| Mar 18, 1865 | 24.5 |
| Mar 31, 1916 | 23 |
| Apr 4, 1896 | 20.2 |
| Apr 2, 1940 | 19.08 |
| Mar 19, 1942 | 18.96 |
| Mar 30, 1950 | 18.59 |
| Dec 2, 1927 | 18.5 |
| Jun 25, 1972 | 17.89 |
| Apr 25, 1984 | 17.55 |
| Mar 28, 1936 | 17.5 |
| Oct 1, 1924 | 17.4 |
| Feb 13, 1925 | 17.38 |
| Mar 31, 1960 | 16.91 |
| Mar 8, 1956 | 16.87 |
| Jan 10, 1998 | 16.8 |
| Apr 23, 1929 | 16.57 |
| Mar 24, 1980 | 16.49 |
| Jan 1, 1943 | 16.36 |
| Mar 15, 1982 | 16.19 |
| Mar 24, 1945 | 16.17 |
Data provided by the National Weather Service.