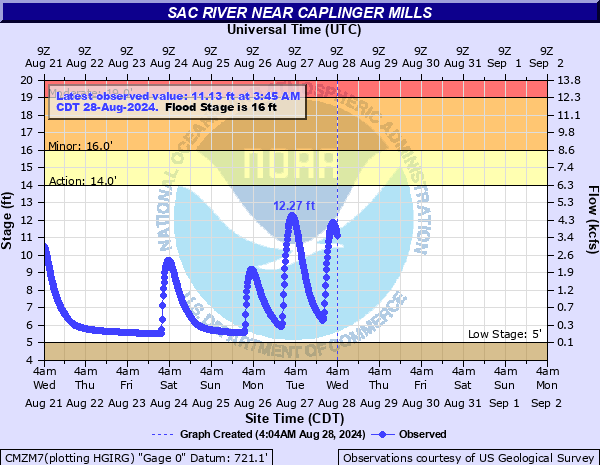
Sac River near Caplinger Mills
Critical Stages
14' - Action
16' - Flood
19' - Moderate
28' - Major
Latest Observation
Updated: 8:45 PM CST 12/16/25
Status: No Flooding
Stage: 7.96 ft
Flow: 1.11 kcfs
Forecast
Forecast not available for this location.
| Time | Stage (ft) | Flow (kcfs) |
|---|---|---|
| 8:45 PM 12/16 | 7.96 | 1.11 |
| 8:30 PM 12/16 | 8.02 | 1.15 |
| 8:15 PM 12/16 | 8.08 | 1.2 |
| 8:00 PM 12/16 | 8.14 | 1.24 |
| 7:45 PM 12/16 | 8.2 | 1.28 |
| 7:30 PM 12/16 | 8.26 | 1.31 |
| 7:15 PM 12/16 | 8.31 | 1.34 |
| 7:00 PM 12/16 | 8.37 | 1.38 |
| 6:45 PM 12/16 | 8.42 | 1.41 |
| 6:30 PM 12/16 | 8.46 | 1.43 |
| 6:15 PM 12/16 | 8.5 | 1.46 |
| 6:00 PM 12/16 | 8.53 | 1.48 |
| 5:45 PM 12/16 | 8.55 | 1.49 |
| 5:30 PM 12/16 | 8.57 | 1.5 |
| 5:15 PM 12/16 | 8.57 | 1.5 |
| 5:00 PM 12/16 | 8.57 | 1.5 |
| 4:45 PM 12/16 | 8.55 | 1.49 |
| 4:30 PM 12/16 | 8.52 | 1.47 |
| 4:15 PM 12/16 | 8.47 | 1.44 |
| 4:00 PM 12/16 | 8.4 | 1.4 |
| 3:45 PM 12/16 | 8.31 | 1.34 |
| 3:30 PM 12/16 | 8.2 | 1.28 |
| 3:15 PM 12/16 | 8.07 | 1.19 |
| 3:00 PM 12/16 | 7.9 | 1.08 |
| 2:45 PM 12/16 | 7.71 | 0.982 |
| 2:30 PM 12/16 | 7.48 | 0.863 |
| 2:15 PM 12/16 | 7.21 | 0.723 |
| 2:00 PM 12/16 | 6.87 | 0.566 |
| 1:45 PM 12/16 | 6.5 | 0.428 |
| 1:30 PM 12/16 | 6.19 | 0.313 |
30.95' -
this is the flood of record reached on April 12 1994.
27' -
flood waters affect fields along the left bank at the gage site.
20' -
flood waters affect low lying areas near the river including farmland along Highway N and between Highway W and Caplinger Mills. Cedar Creek...a tributary of the Sac River backwaters and floods portions of Highway 39 and south of Cedar Springs.
19' -
moderate Flood Stage. Flood waters reach approximately three feet in depth at the Caplinger Mills Campground.
16' -
minor Flooding occurs at the gage site. The campground at Caplinger Mills floods.
| Date | Stage (ft) |
|---|---|
| Apr 12, 1994 | 30.95 |
| Dec 28, 2015 | 30.83 |
| Oct 2, 1986 | 30 |
| Sep 25, 1993 | 29.93 |
| Oct 6, 1998 | 29 |
| Apr 30, 2017 | 28.39 |
| Feb 23, 1985 | 28.15 |
| May 22, 2019 | 27.64 |
| May 2, 2019 | 27.3 |
| Apr 11, 2008 | 26.12 |
| Oct 10, 2009 | 26.03 |
| Nov 4, 1974 | 25.99 |
| May 9, 2009 | 25.88 |
| Jul 2, 2007 | 25.85 |
| May 6, 2022 | 25.81 |
| May 23, 1989 | 25.79 |
| Jun 11, 1995 | 25.48 |
| Mar 19, 2008 | 24.98 |
| Jan 6, 2005 | 24.95 |
| Feb 22, 1997 | 24.61 |
Data provided by the National Weather Service.