« Back to Fort Thompson Rivers
Missouri River at Chamberlain
Critical Stages
63' - Action
65' - Flood
68' - Moderate
70' - Major
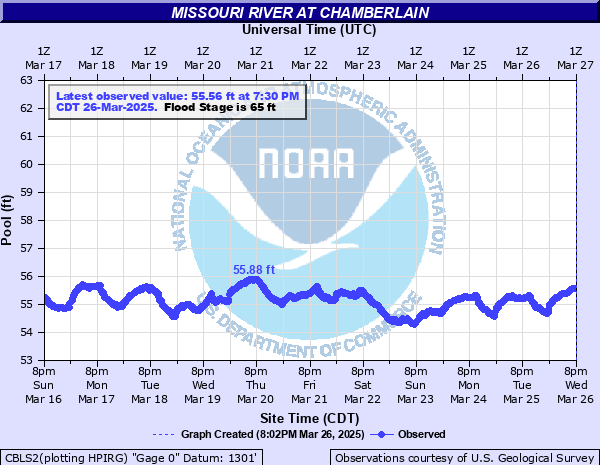
Latest Observation
Updated: 4:30 AM CST 12/8/25
Status: No Flooding
Stage: 48.43 ft
Flow: -999 kcfs
Forecast
Forecast not available for this location.
| Time | Stage (ft) | Flow (kcfs) |
|---|---|---|
| 5:30 AM 12/8 | 48.53 | -999 |
| 5:15 AM 12/8 | 48.51 | -999 |
| 5:00 AM 12/8 | 48.49 | -999 |
| 4:45 AM 12/8 | 48.45 | -999 |
| 4:30 AM 12/8 | 48.43 | -999 |
| 4:15 AM 12/8 | 48.43 | -999 |
| 4:00 AM 12/8 | 48.42 | -999 |
| 3:45 AM 12/8 | 48.41 | -999 |
| 3:30 AM 12/8 | 48.38 | -999 |
| 3:15 AM 12/8 | 48.36 | -999 |
| 3:00 AM 12/8 | 48.36 | -999 |
| 2:45 AM 12/8 | 48.35 | -999 |
| 2:30 AM 12/8 | 48.36 | -999 |
| 2:15 AM 12/8 | 48.34 | -999 |
| 2:00 AM 12/8 | 48.31 | -999 |
| 1:45 AM 12/8 | 48.27 | -999 |
| 1:30 AM 12/8 | 48.24 | -999 |
| 1:15 AM 12/8 | 48.25 | -999 |
| 1:00 AM 12/8 | 48.28 | -999 |
| 12:45 AM 12/8 | 48.3 | -999 |
| 12:30 AM 12/8 | 48.35 | -999 |
| 12:15 AM 12/8 | 48.36 | -999 |
| 12:00 AM 12/8 | 48.36 | -999 |
| 11:45 PM 12/7 | 48.35 | -999 |
| 11:30 PM 12/7 | 48.36 | -999 |
| 11:15 PM 12/7 | 48.4 | -999 |
| 11:00 PM 12/7 | 48.44 | -999 |
| 10:45 PM 12/7 | 48.48 | -999 |
| 10:30 PM 12/7 | 48.49 | -999 |
| 10:15 PM 12/7 | 48.48 | -999 |
70' -
American Creek recreation area will flood.
68' -
Some homes begin to be affected by flood waters.
66' -
Water reaches the top of the boat ramps at American Creek camp ground, West Bridge, and Snake Creek East.
65' -
American Creek marina just upstream of the gauge will begin flooding, and water reaches the top of the boat ramp near Buryanek camp ground.
63' -
Camp grounds begin to flood.
62' -
Water reaches the top of the boat ramps at American Creek marina, Elm Creek #3, Crow Creek, and Dude Ranch.
61' -
Water reaches the top of the boat ramps at Boyer and Snake Creek West.
| Date | Stage (ft) |
|---|---|
| Jul 8, 2011 | 75.08 |
| May 2, 1997 | 72.21 |
| Jun 2, 2019 | 71.08 |
| Jun 23, 2010 | 68.38 |
| Jun 2, 1995 | 67.93 |
| May 9, 2001 | 65.4 |
| May 14, 1999 | 63.48 |
| Jun 14, 2008 | 62.43 |
| Jun 28, 1996 | 61.88 |
| May 12, 2016 | 61.68 |
| Jul 6, 2024 | 61.44 |
| Jul 29, 1993 | 61.28 |
| Jul 3, 2015 | 61.12 |
| May 15, 2007 | 60.83 |
| Jun 8, 1991 | 60.47 |
| Mar 23, 1989 | 59.15 |
| Aug 7, 2020 | 59.1 |
| Jun 7, 2013 | 58.83 |
| Apr 29, 2009 | 58.66 |
| May 6, 2006 | 58.5 |
Data provided by the National Weather Service.