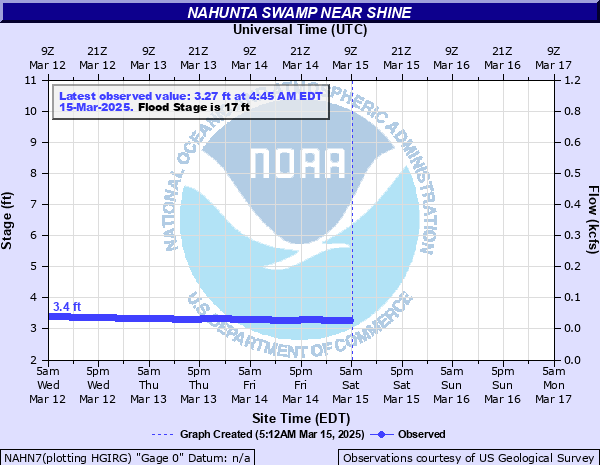
Nahunta Swamp near Shine
Critical Stages
15' - Action
17' - Flood
19' - Moderate
21' - Major
Latest Observation
Updated: 12:45 AM EST 12/15/25
Status: No Flooding
Stage: 3.52 ft
Flow: 0.0434 kcfs
Forecast
Forecast not available for this location.
| Time | Stage (ft) | Flow (kcfs) |
|---|---|---|
| 12:45 AM 12/15 | 3.52 | 0.0434 |
| 12:30 AM 12/15 | 3.52 | 0.0434 |
| 12:15 AM 12/15 | 3.52 | 0.0434 |
| 12:00 AM 12/15 | 3.52 | 0.0434 |
| 11:45 PM 12/14 | 3.52 | 0.0434 |
| 11:30 PM 12/14 | 3.53 | 0.0439 |
| 11:15 PM 12/14 | 3.53 | 0.0439 |
| 11:00 PM 12/14 | 3.53 | 0.0439 |
| 10:45 PM 12/14 | 3.53 | 0.0439 |
| 10:30 PM 12/14 | 3.53 | 0.0439 |
| 10:15 PM 12/14 | 3.53 | 0.0439 |
| 10:00 PM 12/14 | 3.53 | 0.0439 |
| 9:45 PM 12/14 | 3.53 | 0.0439 |
| 9:30 PM 12/14 | 3.52 | 0.0434 |
| 9:15 PM 12/14 | 3.53 | 0.0439 |
| 9:00 PM 12/14 | 3.52 | 0.0434 |
| 8:45 PM 12/14 | 3.52 | 0.0434 |
| 8:30 PM 12/14 | 3.52 | 0.0434 |
| 8:15 PM 12/14 | 3.53 | 0.0439 |
| 8:00 PM 12/14 | 3.52 | 0.0434 |
| 7:45 PM 12/14 | 3.53 | 0.0439 |
| 7:30 PM 12/14 | 3.52 | 0.0434 |
| 7:15 PM 12/14 | 3.52 | 0.0434 |
| 7:00 PM 12/14 | 3.52 | 0.0434 |
| 6:45 PM 12/14 | 3.52 | 0.0434 |
| 6:30 PM 12/14 | 3.51 | 0.0429 |
| 6:15 PM 12/14 | 3.51 | 0.0429 |
| 6:00 PM 12/14 | 3.51 | 0.0429 |
| 5:45 PM 12/14 | 3.5 | 0.0424 |
| 5:30 PM 12/14 | 3.49 | 0.0419 |
21' -
Widespread flooding in the area with all crossings inundated by several feet of water. Several homes and structures are inundated along the entire length of the swamp.
19' -
All crossings along Nahunta Swamp are impassable, including the near the confluence with Contentnea Creek near NC 58. Several homes and structures are surrounded by water.
17' -
Water inundates portions of Bullhead Road, Nahunta Road, and Lanetown Road, making them impassable.
15' -
Water approaches and may cover portions of Bullhead Road and Nahunta Road
| Date | Stage (ft) |
|---|---|
| Sep 17, 1999 | 21 |
| Oct 9, 2016 | 17.92 |
| Sep 15, 2018 | 14.52 |
| Oct 6, 1964 | 14.14 |
| Sep 28, 1999 | 13.04 |
| Nov 13, 2020 | 12.54 |
| Apr 23, 2017 | 12.4 |
| Sep 20, 1955 | 12.37 |
| Sep 2, 2006 | 11.57 |
| Mar 10, 1998 | 11.5 |
| Aug 18, 1992 | 11.36 |
| Jul 8, 2011 | 10.31 |
| Apr 11, 2003 | 10.26 |
| Feb 6, 2010 | 10.26 |
| Aug 28, 2011 | 9.54 |
| Feb 18, 2008 | 9.16 |
| Jul 14, 2013 | 9.09 |
| Mar 22, 2001 | 9.02 |
| Mar 2, 2009 | 8.89 |
| Mar 3, 1994 | 8.86 |
Data provided by the National Weather Service.