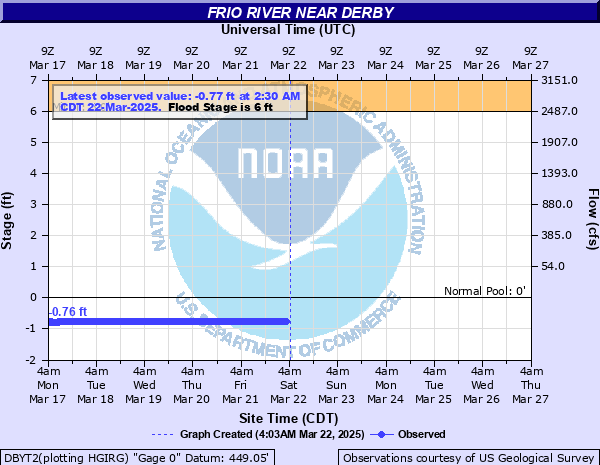
Frio River near Derby
Critical Stages
6' - Action
6' - Flood
7' - Moderate
17' - Major
Latest Observation
Updated: 4:30 PM CST 12/15/25
Status: No Flooding
Stage: -0.93 ft
Flow: -999 kcfs
Forecast
Forecast not available for this location.
| Time | Stage (ft) | Flow (kcfs) |
|---|---|---|
| 4:30 PM 12/15 | -0.93 | -999 |
| 4:15 PM 12/15 | -0.93 | -999 |
| 4:00 PM 12/15 | -0.93 | -999 |
| 3:45 PM 12/15 | -0.93 | -999 |
| 3:30 PM 12/15 | -0.93 | -999 |
| 3:15 PM 12/15 | -0.93 | -999 |
| 3:00 PM 12/15 | -0.93 | -999 |
| 2:45 PM 12/15 | -0.93 | -999 |
| 2:30 PM 12/15 | -0.93 | -999 |
| 2:15 PM 12/15 | -0.93 | -999 |
| 2:00 PM 12/15 | -0.93 | -999 |
| 1:45 PM 12/15 | -0.93 | -999 |
| 1:30 PM 12/15 | -0.93 | -999 |
| 1:15 PM 12/15 | -0.93 | -999 |
| 1:00 PM 12/15 | -0.93 | -999 |
| 12:45 PM 12/15 | -0.93 | -999 |
| 12:30 PM 12/15 | -0.93 | -999 |
| 12:15 PM 12/15 | -0.93 | -999 |
| 12:00 PM 12/15 | -0.93 | -999 |
| 11:45 AM 12/15 | -0.93 | -999 |
| 11:30 AM 12/15 | -0.93 | -999 |
| 11:15 AM 12/15 | -0.93 | -999 |
| 11:00 AM 12/15 | -0.93 | -999 |
| 10:45 AM 12/15 | -0.93 | -999 |
| 10:30 AM 12/15 | -0.93 | -999 |
| 10:15 AM 12/15 | -0.93 | -999 |
| 10:00 AM 12/15 | -0.93 | -999 |
| 9:45 AM 12/15 | -0.93 | -999 |
| 9:30 AM 12/15 | -0.93 | -999 |
| 9:15 AM 12/15 | -0.94 | -999 |
17' -
Major flooding reaches lowest homes and businesses downstream in Tilden. Hundreds of livestock are trapped and potentially drowned in low areas of the flood plain near Derby to Choke Canyon Reservoir. Major flooding of crop and pasture land near the river inundates oil well pump jacks and irrigation pumps.
14' -
Significant crop and pastureland flooding below Uvalde to Choke Canyon Reservoir floods oil well pump jacks, irrigation pumps and any equipment in the flood plain. Numerous secondary roads and low bridges are flooded. Livestock are cut off and potentially drowned in low areas of the flood plain.
10' -
Lowland flooding below Concan to Choke Canyon Reservoir floods oil well pump jacks, irrigation pumps and any equipment in the lower flood plain near and above Derby.
7' -
Moderate lowland flooding closes Farm to Market 1581 near Derby.
6' -
Minor lowland flooding reaches the Farm to Market 1581 bridge floor.
| Date | Stage (ft) |
|---|---|
| Jul 4, 1932 | 29.45 |
| Jun 2, 1935 | 23.7 |
| Jul 21, 2007 | 22.02 |
| Jun 24, 1997 | 21.77 |
| Jul 7, 2002 | 19.87 |
| May 31, 1987 | 17.29 |
| May 26, 2015 | 13.66 |
| Dec 23, 1991 | 11.65 |
| Jun 18, 1981 | 11.17 |
| Jul 18, 1990 | 11.03 |
| Apr 25, 1981 | 9.97 |
| Sep 18, 2018 | 9.95 |
| Mar 6, 1992 | 9.79 |
| Oct 18, 2018 | 9.4 |
| Oct 12, 2018 | 9.09 |
| Sep 24, 2018 | 9.02 |
| Sep 11, 2018 | 8.81 |
Data provided by the National Weather Service.