« Back to Franconia Ridge Trail Rivers
Dog River at Northfield Falls
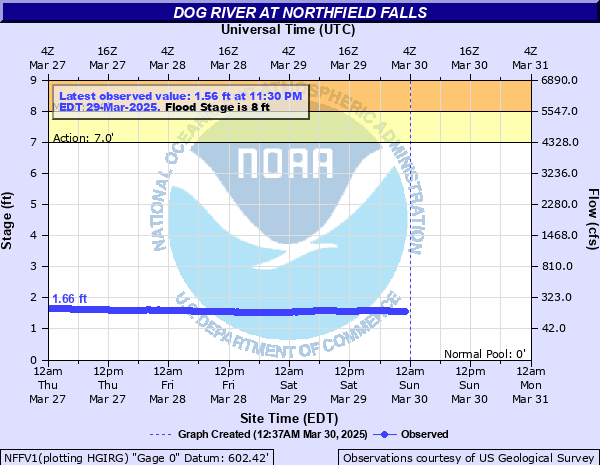
Critical Stages
7' - Action
8' - Flood
10' - Moderate
11' - Major
Latest Observation
Updated: 12:30 PM EST 12/10/25
Status: No Flooding
Stage: 1.09 ft
Flow: 0.0554 kcfs
Forecast
Forecast not available for this location.
| Time | Stage (ft) | Flow (kcfs) |
|---|---|---|
| 1:30 PM 12/10 | 1.09 | 0.0554 |
| 1:15 PM 12/10 | 1.09 | 0.0554 |
| 1:00 PM 12/10 | 1.09 | 0.0554 |
| 12:45 PM 12/10 | 1.08 | 0.0537 |
| 12:30 PM 12/10 | 1.09 | 0.0554 |
| 12:15 PM 12/10 | 1.09 | 0.0554 |
| 12:00 PM 12/10 | 1.09 | 0.0554 |
| 11:45 AM 12/10 | 1.09 | 0.0554 |
| 11:30 AM 12/10 | 1.09 | 0.0554 |
| 11:15 AM 12/10 | 1.09 | 0.0554 |
| 11:00 AM 12/10 | 1.09 | 0.0554 |
| 10:45 AM 12/10 | 1.08 | 0.0537 |
| 10:30 AM 12/10 | 1.08 | 0.0537 |
| 10:15 AM 12/10 | 1.08 | 0.0537 |
| 10:00 AM 12/10 | 1.08 | 0.0537 |
| 9:45 AM 12/10 | 1.08 | 0.0537 |
| 9:30 AM 12/10 | 1.08 | 0.0537 |
| 9:15 AM 12/10 | 1.08 | 0.0537 |
| 9:00 AM 12/10 | 1.09 | 0.0554 |
| 8:45 AM 12/10 | 1.09 | 0.0554 |
| 8:30 AM 12/10 | 1.08 | 0.0537 |
| 8:15 AM 12/10 | 1.08 | 0.0537 |
| 8:00 AM 12/10 | 1.08 | 0.0537 |
| 7:45 AM 12/10 | 1.08 | 0.0537 |
| 7:30 AM 12/10 | 1.08 | 0.0537 |
| 7:15 AM 12/10 | 1.09 | 0.0554 |
| 7:00 AM 12/10 | 1.09 | 0.0554 |
| 6:45 AM 12/10 | 1.09 | 0.0554 |
| 6:30 AM 12/10 | 1.09 | 0.0554 |
| 6:15 AM 12/10 | 1.09 | 0.0554 |
17' -
Devestating flooding throughout the Dog River valley. Route 12 will be inundated, with road damage and bridge washouts. Low structures along the Dog River will be inundated. Flooding will be comparable to Irene in 2011.
9' -
Water will cover low spots of Route 12 between Northfield Falls and Montpelier, and Browns Mill Road in Berlin. Fields and farmland along the Dog River will flood.
8' -
There will be widespread field flooding along the Dog River between Northfield Falls and Montpelier. Water will approach Route 12 in the town of Berlin.
| Date | Stage (ft) |
|---|---|
| Aug 28, 2011 | 17.26 |
| Jul 10, 2023 | 11.63 |
| Jun 30, 1973 | 11.57 |
| Sep 21, 1938 | 11.53 |
| Aug 5, 1989 | 10.16 |
| Mar 31, 1987 | 9.84 |
| Jun 1, 1952 | 9.46 |
| Apr 1, 1976 | 9.13 |
| Jun 3, 1947 | 8.96 |
| Dec 31, 1948 | 8.73 |
| Aug 10, 1976 | 8.56 |
| Dec 2, 2006 | 8.5 |
| Mar 18, 1936 | 8.49 |
| Jan 18, 2006 | 8.46 |
| May 6, 1989 | 8.39 |
| Apr 18, 1982 | 8.29 |
| Jul 1, 2017 | 8.24 |
| May 13, 1981 | 8.07 |
| Dec 21, 1957 | 7.99 |
| Oct 17, 1977 | 7.93 |
Data provided by the National Weather Service.