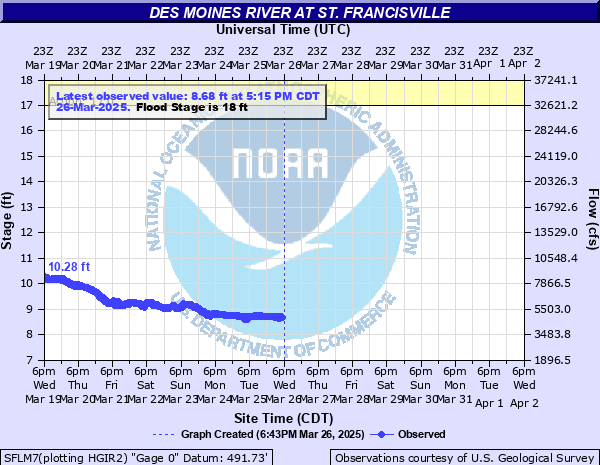
Des Moines River at St. Francisville
Critical Stages
17' - Action
18' - Flood
22' - Moderate
25' - Major
Latest Observation
Updated: 6:15 AM CST 12/16/25
Status: No Flooding
Stage: 7.37 ft
Flow: 2.41 kcfs
Forecast
Forecast not available for this location.
| Time | Stage (ft) | Flow (kcfs) |
|---|---|---|
| 7:15 AM 12/16 | 8.12 | 3.71 |
| 7:00 AM 12/16 | 8.11 | 3.69 |
| 6:45 AM 12/16 | 8.1 | 3.67 |
| 6:30 AM 12/16 | 7.37 | 2.41 |
| 6:15 AM 12/16 | 7.37 | 2.41 |
| 6:00 AM 12/16 | 7.26 | 2.25 |
| 5:45 AM 12/16 | 7.21 | 2.18 |
| 5:30 AM 12/16 | 7.17 | 2.12 |
| 5:15 AM 12/16 | 7.12 | 2.05 |
| 5:00 AM 12/16 | 7.08 | 2 |
| 4:45 AM 12/16 | 7.04 | 1.95 |
| 4:30 AM 12/16 | 7.01 | 1.91 |
| 4:15 AM 12/16 | 6.99 | 1.89 |
| 4:00 AM 12/16 | 7.43 | 2.51 |
| 3:45 AM 12/16 | 7.39 | 2.44 |
| 3:30 AM 12/16 | 7.36 | 2.4 |
| 3:15 AM 12/16 | 7.34 | 2.37 |
| 3:00 AM 12/16 | 7.32 | 2.34 |
| 2:45 AM 12/16 | 7.3 | 2.31 |
| 2:30 AM 12/16 | 7.29 | 2.3 |
| 2:15 AM 12/16 | 6.93 | 1.82 |
| 2:00 AM 12/16 | 6.84 | 1.72 |
| 1:45 AM 12/16 | 6.81 | 1.68 |
| 1:30 AM 12/16 | 6.8 | 1.67 |
| 1:15 AM 12/16 | 6.79 | 1.66 |
| 1:00 AM 12/16 | 6.79 | 1.66 |
| 12:45 AM 12/16 | 6.89 | 1.77 |
| 12:30 AM 12/16 | 7.27 | 2.27 |
| 12:15 AM 12/16 | 7.27 | 2.27 |
| 12:00 AM 12/16 | 7.28 | 2.28 |
33' -
Water affects the gas station in St. Francisville.
32.5' -
Water affects Route B in St. Francisville a well as a gas station.
31' -
Water reaches the bottom of the St. Francisville toll bridge deck.
30' -
Water overtops some agricultural levees and affects the town of Croton.
25' -
Water affects a few homes in St. Francisville and the Fort Pike access area.
22' -
Water rises over the higher river banks.
21' -
Agricultural flooding occurs in areas along the river not protected by levees.
20' -
The St. Francisville boat ramp is under water.
18' -
Flooding occurs over the lower river banks.
| Date | Stage (ft) |
|---|---|
| Jul 15, 1993 | 32.02 |
| Mar 14, 1979 | 30.15 |
| Jan 19, 1973 | 28.22 |
| Jun 17, 2008 | 28.21 |
| May 29, 2019 | 27.86 |
| Jun 9, 1947 | 27.55 |
| Apr 19, 2013 | 26.55 |
| May 18, 1986 | 26.3 |
| Apr 24, 1976 | 26.27 |
| Apr 12, 1965 | 26.15 |
| Jun 15, 2011 | 26.09 |
| Jan 28, 1974 | 25.53 |
| Apr 2, 1960 | 25.2 |
| Apr 2, 1983 | 24.8 |
| May 27, 1996 | 24.42 |
| May 29, 2013 | 23.91 |
| Mar 16, 2001 | 23.82 |
| Apr 20, 1993 | 23.51 |
| May 14, 2001 | 23.35 |
| Jun 30, 1954 | 23.25 |
Data provided by the National Weather Service.