« Back to Funter Bay Seaplane Rivers
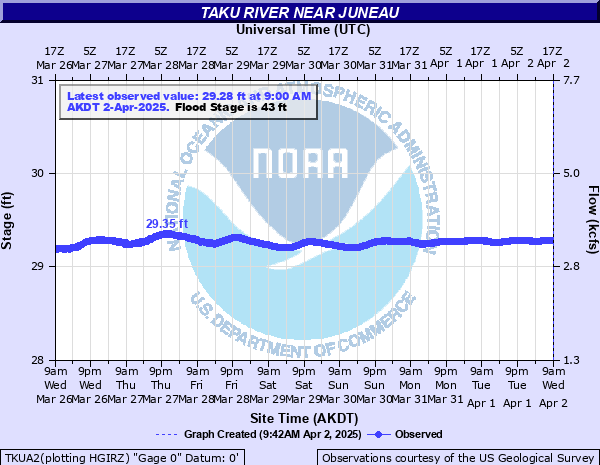
Taku River near Juneau
Critical Stages
42' - Action
43' - Flood
44' - Moderate
46' - Major
Latest Observation
Updated: 1:00 PM AKST 12/15/25
Status: No Flooding
Stage: 31.63 ft
Flow: 8.72 kcfs
Forecast
Forecast not available for this location.
| Time | Stage (ft) | Flow (kcfs) |
|---|---|---|
| 2:00 PM 12/15 | 31.64 | 8.75 |
| 1:45 PM 12/15 | 31.64 | 8.75 |
| 1:30 PM 12/15 | 31.64 | 8.75 |
| 1:15 PM 12/15 | 31.63 | 8.72 |
| 1:00 PM 12/15 | 31.63 | 8.72 |
| 12:45 PM 12/15 | 31.63 | 8.72 |
| 12:30 PM 12/15 | 31.62 | 8.69 |
| 12:15 PM 12/15 | 31.63 | 8.72 |
| 12:00 PM 12/15 | 31.63 | 8.72 |
| 11:45 AM 12/15 | 31.63 | 8.72 |
| 11:30 AM 12/15 | 31.63 | 8.72 |
| 11:15 AM 12/15 | 31.62 | 8.69 |
| 11:00 AM 12/15 | 31.62 | 8.69 |
| 10:45 AM 12/15 | 31.63 | 8.72 |
| 10:30 AM 12/15 | 31.62 | 8.69 |
| 10:15 AM 12/15 | 31.61 | 8.66 |
| 10:00 AM 12/15 | 31.61 | 8.66 |
| 9:45 AM 12/15 | 31.61 | 8.66 |
| 9:30 AM 12/15 | 31.61 | 8.66 |
| 9:15 AM 12/15 | 31.62 | 8.69 |
| 9:00 AM 12/15 | 31.61 | 8.66 |
| 8:45 AM 12/15 | 31.61 | 8.66 |
| 8:30 AM 12/15 | 31.61 | 8.66 |
| 8:15 AM 12/15 | 31.62 | 8.69 |
| 8:00 AM 12/15 | 31.61 | 8.66 |
| 7:45 AM 12/15 | 31.6 | 8.62 |
| 7:30 AM 12/15 | 31.61 | 8.66 |
| 7:15 AM 12/15 | 31.61 | 8.66 |
| 7:00 AM 12/15 | 31.6 | 8.62 |
| 6:45 AM 12/15 | 31.61 | 8.66 |
45' -
Multiple homes, cabins and outbuildings will be flooded along the river. There will also be damage to docks from debris and high flows.
44.68' -
The water level will be at the door jam of the house near the gauge. Other homes and outbuildings along the river will begin to flood.
43.34' -
The water level will be at the top of the hill in front of the house near the gauge.
| Date | Stage (ft) |
|---|---|
| Jun 30, 2021 | 45.54 |
| Jun 25, 2004 | 45.07 |
| Jul 22, 2007 | 44.28 |
| Aug 17, 1989 | 44.13 |
| Jul 16, 2014 | 43.95 |
| Jul 30, 1994 | 43.88 |
| Jul 26, 2000 | 43.77 |
| Jul 1, 2022 | 43.38 |
| Jul 23, 2009 | 43.36 |
| Jul 26, 1995 | 43.23 |
| Oct 1, 2022 | 42.98 |
| Jul 28, 1993 | 42.89 |
| Aug 19, 2008 | 42.73 |
| Jul 5, 2020 | 42.52 |
| Aug 20, 1992 | 42.46 |
| Jun 30, 2005 | 42.34 |
| Sep 2, 2006 | 42.21 |
| Jun 27, 2023 | 42.19 |
| Jul 20, 1990 | 42.1 |
| Jul 2, 2015 | 42.03 |
Data provided by the National Weather Service.