Mississippi River at Red Wing
Critical Stages
12' - Action
14' - Flood
15' - Moderate
16' - Major
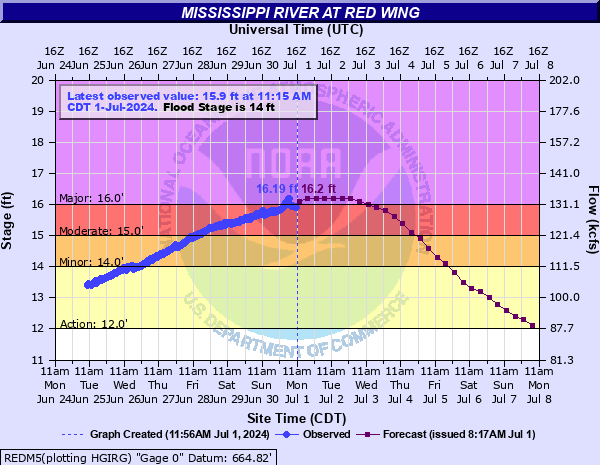
Latest Observation
Updated: 9:15 PM CST 12/14/25
Status: No Flooding
Stage: 2.6 ft
Flow: 12.7 kcfs
Forecast
Forecast not available for this location.
| Time | Stage (ft) | Flow (kcfs) |
|---|---|---|
| 9:15 PM 12/14 | 2.6 | 12.7 |
| 9:00 PM 12/14 | 2.58 | 12.6 |
| 8:45 PM 12/14 | 2.58 | 12.6 |
| 8:30 PM 12/14 | 2.58 | 12.6 |
| 8:15 PM 12/14 | 2.59 | 12.6 |
| 8:00 PM 12/14 | 2.59 | 12.6 |
| 7:45 PM 12/14 | 2.59 | 12.6 |
| 7:30 PM 12/14 | 2.59 | 12.6 |
| 7:15 PM 12/14 | 2.59 | 12.6 |
| 7:00 PM 12/14 | 2.59 | 12.6 |
| 6:45 PM 12/14 | 2.59 | 12.6 |
| 6:30 PM 12/14 | 2.59 | 12.6 |
| 6:15 PM 12/14 | 2.59 | 12.6 |
| 6:00 PM 12/14 | 2.59 | 12.6 |
| 5:45 PM 12/14 | 2.59 | 12.6 |
| 5:30 PM 12/14 | 2.59 | 12.6 |
| 5:15 PM 12/14 | 2.6 | 12.7 |
| 5:00 PM 12/14 | 2.6 | 12.7 |
| 4:45 PM 12/14 | 2.6 | 12.7 |
| 4:30 PM 12/14 | 2.6 | 12.7 |
| 4:15 PM 12/14 | 2.6 | 12.7 |
| 4:00 PM 12/14 | 2.6 | 12.7 |
| 3:45 PM 12/14 | 2.6 | 12.7 |
| 3:30 PM 12/14 | 2.6 | 12.7 |
| 3:15 PM 12/14 | 2.6 | 12.7 |
| 3:00 PM 12/14 | 2.6 | 12.7 |
| 2:45 PM 12/14 | 2.6 | 12.7 |
| 2:30 PM 12/14 | 2.6 | 12.7 |
| 2:15 PM 12/14 | 2.6 | 12.7 |
| 2:00 PM 12/14 | 2.6 | 12.7 |
19.7' -
Red Wing wastewater treatment plant begins to experience flooding.
17' -
Milwaukee Road railroad between Red Wing and Hastings begins flooding.
16' -
Red Wing Milling Company may experience basement flooding and begin pumping.
15' -
The city of Frontenac and Bay City begin flooding.
14.3' -
Lock and dam 3 may end operations.
14' -
Low lying areas and some roads along the river begin to experience flooding.
| Date | Stage (ft) |
|---|---|
| Apr 18, 1965 | 20.7 |
| Apr 17, 1969 | 18.8 |
| Apr 28, 2001 | 18.2 |
| Apr 17, 2001 | 18.1 |
| Apr 12, 1997 | 17.18 |
| Apr 18, 1952 | 17 |
| Apr 25, 2023 | 16.55 |
| Apr 17, 1951 | 16.4 |
| Jul 1, 2024 | 16.19 |
| Apr 1, 2019 | 15.81 |
| Jun 28, 1993 | 15.3 |
| May 1, 1975 | 14.91 |
| Apr 7, 1986 | 14.9 |
| Apr 15, 2011 | 14.72 |
| Jun 29, 2014 | 14.7 |
| Apr 5, 1967 | 14.3 |
| Mar 26, 2010 | 12.93 |
| May 1, 2018 | 12.76 |
| Jun 23, 2018 | 12.3 |
| May 25, 2017 | 11.23 |
Data provided by the National Weather Service.