Mississippi River at St. Paul
Critical Stages
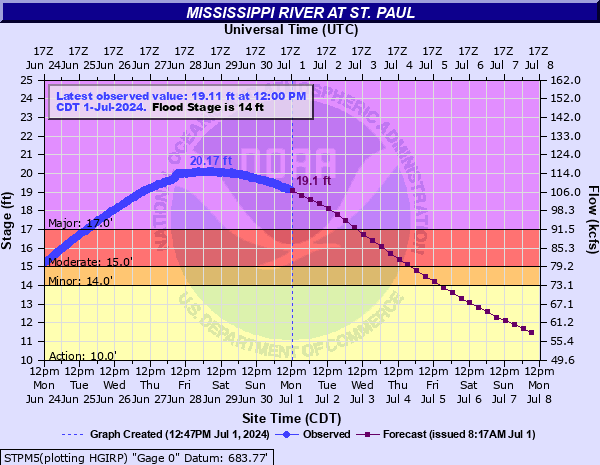
10' - Action
14' - Flood
15' - Moderate
17' - Major
Latest Observation
Updated: 9:10 PM CST 12/14/25
Status: No Flooding
Stage: 3.19 ft
Flow: 5.31 kcfs
Forecast
Forecast not available for this location.
| Time | Stage (ft) | Flow (kcfs) |
|---|---|---|
| 9:10 PM 12/14 | 3.19 | 5.31 |
| 9:05 PM 12/14 | 3.19 | 5.31 |
| 9:00 PM 12/14 | 3.2 | 5.43 |
| 8:55 PM 12/14 | 3.21 | 5.55 |
| 8:50 PM 12/14 | 3.22 | 5.68 |
| 8:45 PM 12/14 | 3.21 | 5.55 |
| 8:40 PM 12/14 | 3.2 | 5.43 |
| 8:35 PM 12/14 | 3.21 | 5.55 |
| 8:30 PM 12/14 | 3.2 | 5.43 |
| 8:10 PM 12/14 | 3.22 | 5.68 |
| 8:05 PM 12/14 | 3.21 | 5.55 |
| 8:00 PM 12/14 | 3.2 | 5.43 |
| 7:55 PM 12/14 | 3.21 | 5.55 |
| 7:50 PM 12/14 | 3.2 | 5.43 |
| 7:45 PM 12/14 | 3.2 | 5.43 |
| 7:40 PM 12/14 | 3.2 | 5.43 |
| 7:35 PM 12/14 | 3.2 | 5.43 |
| 7:30 PM 12/14 | 3.2 | 5.43 |
| 7:10 PM 12/14 | 3.2 | 5.43 |
| 7:05 PM 12/14 | 3.2 | 5.43 |
| 7:00 PM 12/14 | 3.2 | 5.43 |
| 6:55 PM 12/14 | 3.2 | 5.43 |
| 6:50 PM 12/14 | 3.2 | 5.43 |
| 6:45 PM 12/14 | 3.2 | 5.43 |
| 6:40 PM 12/14 | 3.2 | 5.43 |
| 6:35 PM 12/14 | 3.21 | 5.55 |
| 6:30 PM 12/14 | 3.19 | 5.31 |
| 6:10 PM 12/14 | 3.2 | 5.43 |
| 6:05 PM 12/14 | 3.2 | 5.43 |
| 6:00 PM 12/14 | 3.2 | 5.43 |
31' -
Top of Right Bank Levee in St Paul across from the city side.
29' -
**Updated level from the USACE - Top of Right Bank Levee in the city of South St Paul
18' -
Warner Road may become impassable due to high water.
17.5' -
Harriet Island begins to become submerged.
14' -
Portions of the Lilydale park area begin to experience flooding.
13.3' -
Water begins to encroach on Water St.
| Date | Stage (ft) |
|---|---|
| Apr 16, 1965 | 26.01 |
| Apr 15, 1969 | 24.52 |
| Apr 18, 2001 | 23.76 |
| Apr 30, 2001 | 23.2 |
| Apr 13, 1997 | 22.37 |
| Apr 16, 1952 | 22.02 |
| Mar 31, 2019 | 20.19 |
| Jun 29, 2024 | 20.17 |
| Jun 26, 2014 | 20.13 |
| Jun 26, 1993 | 19.15 |
| Mar 29, 2011 | 19.02 |
| Apr 16, 1951 | 18.79 |
| Apr 10, 2011 | 18.71 |
| Mar 24, 2010 | 18.38 |
| Apr 26, 2023 | 18.13 |
| Apr 6, 1987 | 18 |
| Jun 2, 1908 | 16.8 |
| Oct 2, 2010 | 16.7 |
| Jun 29, 1957 | 16.68 |
| Apr 6, 1916 | 16.6 |
Data provided by the National Weather Service.