Iowa River at Wapello
Critical Stages
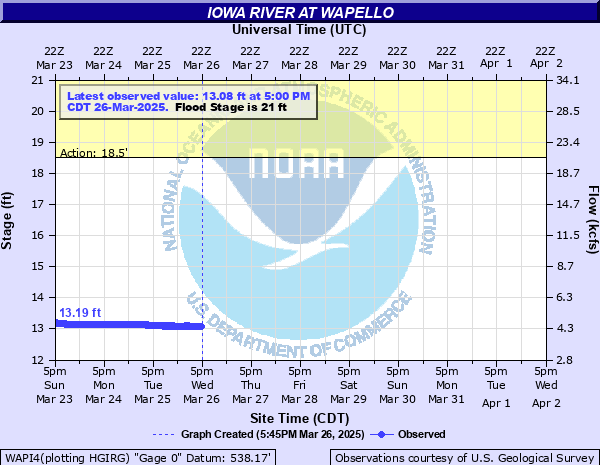
18.5' - Action
21' - Flood
25' - Moderate
27.5' - Major
Latest Observation
Updated: 11:00 AM CST 12/16/25
Status: No Flooding
Stage: 11.69 ft
Flow: 2.93 kcfs
Forecast
Forecast not available for this location.
| Time | Stage (ft) | Flow (kcfs) |
|---|---|---|
| 11:00 AM 12/16 | 11.69 | 2.93 |
| 10:45 AM 12/16 | 11.7 | 2.94 |
| 10:30 AM 12/16 | 11.71 | 2.96 |
| 10:15 AM 12/16 | 11.71 | 2.96 |
| 10:00 AM 12/16 | 11.71 | 2.96 |
| 9:45 AM 12/16 | 11.71 | 2.96 |
| 9:30 AM 12/16 | 11.71 | 2.96 |
| 9:15 AM 12/16 | 11.71 | 2.96 |
| 9:00 AM 12/16 | 11.7 | 2.94 |
| 8:45 AM 12/16 | 11.69 | 2.93 |
| 8:30 AM 12/16 | 11.68 | 2.92 |
| 8:15 AM 12/16 | 11.67 | 2.9 |
| 8:00 AM 12/16 | 11.65 | 2.88 |
| 7:45 AM 12/16 | 11.64 | 2.86 |
| 7:30 AM 12/16 | 11.62 | 2.83 |
| 7:15 AM 12/16 | 11.61 | 2.82 |
| 7:00 AM 12/16 | 11.6 | 2.81 |
| 6:45 AM 12/16 | 11.58 | 2.78 |
| 6:30 AM 12/16 | 11.57 | 2.77 |
| 6:15 AM 12/16 | 11.56 | 2.75 |
| 6:00 AM 12/16 | 11.54 | 2.73 |
| 5:45 AM 12/16 | 11.53 | 2.71 |
| 5:30 AM 12/16 | 11.51 | 2.69 |
| 5:15 AM 12/16 | 11.5 | 2.67 |
| 5:00 AM 12/16 | 11.49 | 2.66 |
| 4:45 AM 12/16 | 11.48 | 2.65 |
| 4:30 AM 12/16 | 11.47 | 2.63 |
| 4:15 AM 12/16 | 11.45 | 2.61 |
| 4:00 AM 12/16 | 11.45 | 2.61 |
| 3:45 AM 12/16 | 11.43 | 2.58 |
42' -
Water overtops the Wapello levee system which extends 3.5 to 5.0 mi downstream from the city.
41' -
Water is at the bottom of the U.S. Highway 61 bridge.
38' -
Water is at the bottom of the Iowa Highway 99 bridge at Wapello.
32' -
Water affects unprotected areas of Wapello.
27.5' -
Major Flood Stage. Water affects U.S. Highway 61 north of Wapello.
25' -
Moderate Flood Stage. Widespread flooding of agricultural land. Numerous secondary roads are under water.
22' -
Water affects residences near the U.S. Highway 61 bridge.
21' -
Minor Flood Stage. Agricultural land near the river is flooded and water covers most islands. Water starts rising onto secondary roads in Wapello Bottoms.
20' -
Low lying areas begin taking on water.
| Date | Stage (ft) |
|---|---|
| Jun 14, 2008 | 32.15 |
| Jul 3, 2014 | 30.18 |
| Jul 7, 1993 | 29.53 |
| Jun 19, 1990 | 28.91 |
| Apr 22, 1973 | 28.63 |
| Apr 20, 2013 | 28.15 |
| May 19, 1974 | 28.12 |
| Jul 8, 1993 | 28.1 |
| May 31, 2019 | 27.21 |
| Sep 30, 2016 | 27.2 |
| Oct 11, 2018 | 26.78 |
| May 31, 2004 | 26.65 |
| Mar 21, 2019 | 26.47 |
| Sep 8, 2018 | 25.81 |
| Mar 22, 1979 | 25.3 |
| May 19, 1986 | 25.14 |
| Jul 29, 1999 | 25.09 |
| May 12, 1996 | 24.77 |
| Feb 23, 1997 | 24.7 |
| Mar 19, 2010 | 24.4 |
Data provided by the National Weather Service.