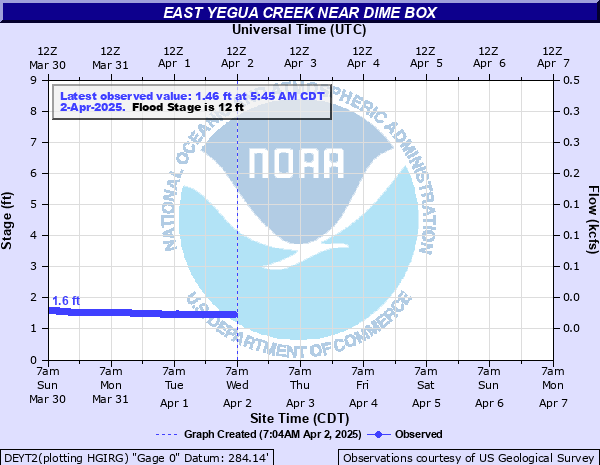
East Yegua Creek near Dime Box
Critical Stages
9' - Action
12' - Flood
16' - Moderate
20' - Major
Latest Observation
Updated: 2:45 PM CST 12/15/25
Status: No Flooding
Stage: 1.35 ft
Flow: 0.0017 kcfs
Forecast
Forecast not available for this location.
| Time | Stage (ft) | Flow (kcfs) |
|---|---|---|
| 2:45 PM 12/15 | 1.35 | 0.0017 |
| 2:30 PM 12/15 | 1.35 | 0.0017 |
| 2:15 PM 12/15 | 1.35 | 0.0017 |
| 2:00 PM 12/15 | 1.35 | 0.0017 |
| 1:45 PM 12/15 | 1.35 | 0.0017 |
| 1:30 PM 12/15 | 1.35 | 0.0017 |
| 1:15 PM 12/15 | 1.35 | 0.0017 |
| 1:00 PM 12/15 | 1.35 | 0.0017 |
| 12:45 PM 12/15 | 1.35 | 0.0017 |
| 12:30 PM 12/15 | 1.35 | 0.0017 |
| 12:15 PM 12/15 | 1.35 | 0.0017 |
| 12:00 PM 12/15 | 1.35 | 0.0017 |
| 11:45 AM 12/15 | 1.35 | 0.0017 |
| 11:30 AM 12/15 | 1.35 | 0.0017 |
| 11:15 AM 12/15 | 1.35 | 0.0017 |
| 11:00 AM 12/15 | 1.35 | 0.0017 |
| 10:45 AM 12/15 | 1.34 | 0.0016 |
| 10:30 AM 12/15 | 1.35 | 0.0017 |
| 10:15 AM 12/15 | 1.35 | 0.0017 |
| 10:00 AM 12/15 | 1.36 | 0.0017 |
| 9:45 AM 12/15 | 1.36 | 0.0017 |
| 9:30 AM 12/15 | 1.35 | 0.0017 |
| 9:15 AM 12/15 | 1.36 | 0.0017 |
| 9:00 AM 12/15 | 1.36 | 0.0017 |
| 8:45 AM 12/15 | 1.36 | 0.0017 |
| 8:30 AM 12/15 | 1.36 | 0.0017 |
| 8:15 AM 12/15 | 1.36 | 0.0017 |
| 8:00 AM 12/15 | 1.37 | 0.0017 |
| 7:45 AM 12/15 | 1.36 | 0.0017 |
| 7:30 AM 12/15 | 1.36 | 0.0017 |
22' -
Water is to the bridge floor at State Highway 21.
20' -
Major lowland flooding begins as the approaches to the State Highway 21 bridge are inundated and impassable.
18' -
Moderate lowland flooding continues with water up to the bottom steel of the State Highway 21 bridge.
16' -
Moderate lowland flooding begins as widespread inundation of the floodplain continues. Water is within 2 feet of the bottom steel of the State Highway 21 bridge.
12' -
Minor lowlaand flooding begins as widespread inundation of the floodplain occurs primarily impacting agricultural interests. Backwater flooding up Dry and Sand Creeks in Burleson County is likely.
| Date | Stage (ft) |
|---|---|
| May 4, 2019 | 15.25 |
| Sep 10, 2001 | 14.95 |
| May 24, 1975 | 13.91 |
| May 26, 2015 | 13.08 |
| Sep 14, 1974 | 13.07 |
| Oct 17, 1994 | 12.98 |
| Nov 5, 2002 | 12.98 |
| Dec 22, 1991 | 12.94 |
| Feb 21, 2003 | 12.58 |
| Aug 29, 2017 | 12.39 |
| Jun 9, 2010 | 12.38 |
| Nov 22, 2004 | 12.27 |
| Jun 24, 1968 | 12.04 |
| Nov 15, 1998 | 11.82 |
| Feb 25, 1992 | 11.78 |
| Jun 8, 1986 | 11.67 |
| May 27, 2016 | 11.65 |
| Apr 25, 1990 | 11.6 |
| Dec 16, 1994 | 11.58 |
| Mar 28, 1980 | 11.54 |
Data provided by the National Weather Service.