Blanchard River at Ottawa
Critical Stages
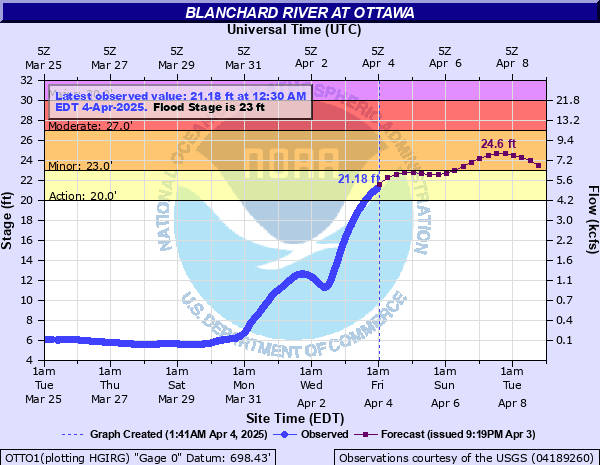
20' - Action
23' - Flood
27' - Moderate
30' - Major
Latest Observation
Updated: 7:30 AM EST 12/16/25
Status: No Flooding
Stage: 4.96 ft
Flow: 0.045 kcfs
Forecast
Forecast not available for this location.
| Time | Stage (ft) | Flow (kcfs) |
|---|---|---|
| 7:30 AM 12/16 | 4.96 | 0.045 |
| 7:15 AM 12/16 | 4.96 | 0.045 |
| 7:00 AM 12/16 | 4.97 | 0.0457 |
| 6:45 AM 12/16 | 4.97 | 0.0457 |
| 6:30 AM 12/16 | 4.98 | 0.0463 |
| 6:15 AM 12/16 | 4.98 | 0.0463 |
| 6:00 AM 12/16 | 4.98 | 0.0463 |
| 5:45 AM 12/16 | 4.99 | 0.047 |
| 5:30 AM 12/16 | 5 | 0.0477 |
| 5:15 AM 12/16 | 5 | 0.0477 |
| 5:00 AM 12/16 | 5 | 0.0477 |
| 4:45 AM 12/16 | 5.01 | 0.0484 |
| 4:30 AM 12/16 | 5.01 | 0.0484 |
| 4:15 AM 12/16 | 5.02 | 0.0491 |
| 4:00 AM 12/16 | 5.02 | 0.0491 |
| 3:45 AM 12/16 | 5.03 | 0.0498 |
| 3:30 AM 12/16 | 5.03 | 0.0498 |
| 3:15 AM 12/16 | 5.04 | 0.0505 |
| 3:00 AM 12/16 | 5.05 | 0.0513 |
| 2:45 AM 12/16 | 5.05 | 0.0513 |
| 2:30 AM 12/16 | 5.06 | 0.052 |
| 2:15 AM 12/16 | 5.06 | 0.052 |
| 2:00 AM 12/16 | 5.07 | 0.0528 |
| 1:45 AM 12/16 | 5.08 | 0.0535 |
| 1:30 AM 12/16 | 5.08 | 0.0535 |
| 1:15 AM 12/16 | 5.09 | 0.0543 |
| 1:00 AM 12/16 | 5.1 | 0.0551 |
| 12:45 AM 12/16 | 5.1 | 0.0551 |
| 12:30 AM 12/16 | 5.11 | 0.0559 |
| 12:15 AM 12/16 | 5.12 | 0.0567 |
29' -
Widespread major flooding occurs throughout downtown Ottawa.
27' -
Flooding worsens on the south side of Ottawa, with water on several roads. Flooding also begins in other areas of Ottawa.
26.6' -
Flood water begins to hit the bottom of the bridge at the gage site.
25' -
Flooding begins along south Walnut and west Second Streets on the south side of Ottawa.
23' -
Lowland flooding occurs mainly in south Ottawa. Flood water also gets into low farmlands.
| Date | Stage (ft) |
|---|---|
| Mar 25, 1913 | 33.3 |
| Aug 23, 2007 | 31.4 |
| Jun 15, 1981 | 29.75 |
| Feb 11, 1959 | 29.72 |
| Feb 7, 2008 | 29.29 |
| Dec 23, 2013 | 28.85 |
| Mar 9, 2009 | 28.72 |
| Mar 2, 2011 | 28.46 |
| Jun 2, 1997 | 28.4 |
| Jul 15, 2017 | 27.55 |
| Apr 13, 2013 | 27.31 |
| Jan 13, 2005 | 27.25 |
| Jan 7, 2007 | 27.09 |
| Mar 13, 1982 | 26.65 |
| Dec 31, 1990 | 26.51 |
| Feb 28, 1997 | 26.5 |
| Dec 3, 2006 | 26.5 |
| Dec 1, 2011 | 26.33 |
| Jan 1, 1991 | 26.08 |
| May 12, 2003 | 26.06 |
Data provided by the National Weather Service.