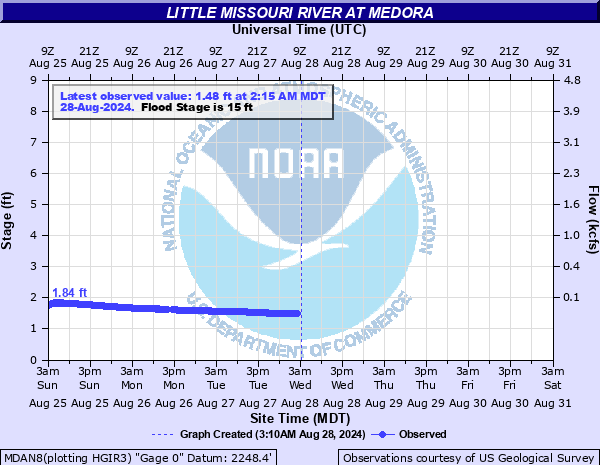
Little Missouri River at Medora
Critical Stages
13' - Action
15' - Flood
18' - Moderate
20' - Major
Latest Observation
Updated: 2:15 AM MST 12/18/25
Status: No Flooding
Stage: 3.59 ft
Flow: 0.723 kcfs
Forecast
Forecast not available for this location.
| Time | Stage (ft) | Flow (kcfs) |
|---|---|---|
| 2:15 AM 12/18 | 3.59 | 0.723 |
| 2:00 AM 12/18 | 3.6 | 0.729 |
| 1:45 AM 12/18 | 3.6 | 0.729 |
| 1:30 AM 12/18 | 3.6 | 0.729 |
| 10:15 PM 12/17 | 3.76 | 0.817 |
| 10:00 PM 12/17 | 3.85 | 0.866 |
| 9:45 PM 12/17 | 3.83 | 0.855 |
| 9:30 PM 12/17 | 3.83 | 0.855 |
| 9:15 PM 12/17 | 3.82 | 0.85 |
| 9:00 PM 12/17 | 3.82 | 0.85 |
| 8:45 PM 12/17 | 3.81 | 0.844 |
| 8:30 PM 12/17 | 3.82 | 0.85 |
| 8:15 PM 12/17 | 3.82 | 0.85 |
| 8:00 PM 12/17 | 3.82 | 0.85 |
| 7:45 PM 12/17 | 3.82 | 0.85 |
| 7:30 PM 12/17 | 3.82 | 0.85 |
| 7:15 PM 12/17 | 3.82 | 0.85 |
| 7:00 PM 12/17 | 3.81 | 0.844 |
| 6:45 PM 12/17 | 3.82 | 0.85 |
| 6:30 PM 12/17 | 3.83 | 0.855 |
| 6:15 PM 12/17 | 3.81 | 0.844 |
| 6:00 PM 12/17 | 3.79 | 0.833 |
| 5:45 PM 12/17 | 3.81 | 0.844 |
| 5:30 PM 12/17 | 3.8 | 0.839 |
| 4:15 PM 12/17 | 3.76 | 0.817 |
| 4:00 PM 12/17 | 3.74 | 0.806 |
| 3:45 PM 12/17 | 3.74 | 0.806 |
| 3:30 PM 12/17 | 3.71 | 0.789 |
| 3:15 PM 12/17 | 3.73 | 0.8 |
| 3:00 PM 12/17 | 3.77 | 0.822 |
19' -
Much of the town of Medora is susceptible to flooding. The steep bank on the left side is subject to overflow.
18' -
Highway 10 begins to flood-town of Medora very flat and is subject to flooding.
17' -
A few rural homes next to the river near Medora may be flooded.
15' -
Right bank overflows and damages camping area on the west side of Medora.
13' -
Water backs up into ditches along Highway 10. Cottonwood campground-5 mi into park has water out of banksin very low spots. Campground and Visitor Center unharmed.
12' -
Low spots on right bank overflow.
| Date | Stage (ft) |
|---|---|
| Mar 23, 1947 | 20.5 |
| May 25, 2011 | 20.39 |
| Mar 11, 1972 | 18.68 |
| Mar 25, 2019 | 18.57 |
| Apr 8, 1952 | 17.32 |
| Jun 7, 1929 | 17.2 |
| Mar 28, 1978 | 16.52 |
| Apr 19, 2009 | 16.43 |
| Mar 14, 2014 | 16.05 |
| Apr 24, 1907 | 16 |
| Mar 2, 2020 | 15.71 |
| Mar 20, 2010 | 14.15 |
| Jun 16, 1915 | 14.1 |
| May 9, 1975 | 14 |
| Jul 27, 1955 | 13.9 |
| Apr 25, 2006 | 13.82 |
| Apr 16, 2018 | 12.92 |
| Jun 9, 2007 | 11.75 |
| May 11, 2008 | 11.7 |
| Jun 1, 2013 | 11.52 |
Data provided by the National Weather Service.