« Back to Glen Campbell Rivers
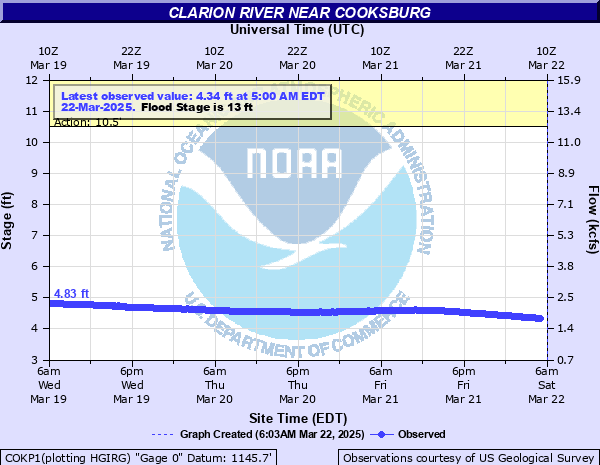
Clarion River near Cooksburg
Critical Stages
10.5' - Action
13' - Flood
15' - Moderate
17' - Major
Latest Observation
Updated: 5:00 PM EST 12/15/25
Status: No Flooding
Stage: 3.85 ft
Flow: 1.31 kcfs
Forecast
Forecast not available for this location.
| Time | Stage (ft) | Flow (kcfs) |
|---|---|---|
| 5:00 PM 12/15 | 3.85 | 1.31 |
| 4:45 PM 12/15 | 3.87 | 1.33 |
| 4:30 PM 12/15 | 3.88 | 1.34 |
| 4:15 PM 12/15 | 3.9 | 1.36 |
| 4:00 PM 12/15 | 3.91 | 1.36 |
| 3:45 PM 12/15 | 3.91 | 1.36 |
| 3:30 PM 12/15 | 3.92 | 1.37 |
| 3:15 PM 12/15 | 3.92 | 1.37 |
| 3:00 PM 12/15 | 3.92 | 1.37 |
| 2:45 PM 12/15 | 3.92 | 1.37 |
| 2:30 PM 12/15 | 3.93 | 1.38 |
| 2:15 PM 12/15 | 3.93 | 1.38 |
| 2:00 PM 12/15 | 3.93 | 1.38 |
| 1:45 PM 12/15 | 3.92 | 1.37 |
| 1:30 PM 12/15 | 3.92 | 1.37 |
| 1:15 PM 12/15 | 3.91 | 1.36 |
| 1:00 PM 12/15 | 3.9 | 1.36 |
| 12:45 PM 12/15 | 3.9 | 1.36 |
| 12:30 PM 12/15 | 3.9 | 1.36 |
| 12:15 PM 12/15 | 3.9 | 1.36 |
| 12:00 PM 12/15 | 3.89 | 1.35 |
| 11:45 AM 12/15 | 3.89 | 1.35 |
| 11:30 AM 12/15 | 3.88 | 1.34 |
| 11:15 AM 12/15 | 3.88 | 1.34 |
| 11:00 AM 12/15 | 3.88 | 1.34 |
| 10:45 AM 12/15 | 3.88 | 1.34 |
| 10:30 AM 12/15 | 3.89 | 1.35 |
| 10:15 AM 12/15 | 3.9 | 1.36 |
| 10:00 AM 12/15 | 3.9 | 1.36 |
| 9:45 AM 12/15 | 3.92 | 1.37 |
19' -
Post office floods, and was the estimated flood stage during the Saint Patrick's Day Flood of 1936.
18.84' -
Flood waters reach the levels that were reached during Hurricane Agnes in 1972.
18.69' -
Flood waters reach the levels that were reached during the flood of May 2014.
18.5' -
The post office parking lot floods. Water reached an areas about 10 feet up hill from the intersection of Cemetery Road and River Road.
18' -
Several feet of water in the lower end of the Cook State Forest office parking lot.
17' -
The basement of the Cook Forest State Park office starts flooding.
14' -
About 1 foot of water covers River Road near the Cook Forest State Park office.
13' -
Macbeth Cabins flood and water reaches River Road near the State Park office
| Date | Stage (ft) |
|---|---|
| Mar 17, 1936 | 19 |
| Jun 23, 1972 | 18.84 |
| May 22, 2014 | 18.69 |
| Mar 6, 1979 | 17.6 |
| Jan 26, 1978 | 17.4 |
| Dec 1, 2010 | 17.39 |
| Feb 3, 1970 | 17.1 |
| Sep 18, 2004 | 16.5 |
| Jan 19, 1996 | 16.4 |
| Jun 21, 1989 | 16.1 |
| Jan 21, 1959 | 15.4 |
| Jun 21, 2019 | 15.17 |
| Jan 26, 2010 | 15 |
| Mar 15, 2007 | 14.99 |
| Mar 9, 2009 | 14.64 |
| Feb 10, 2001 | 14.09 |
| Mar 6, 2011 | 14.03 |
| Apr 12, 2024 | 13.6 |
| Sep 9, 2004 | 13.4 |
| Feb 18, 2022 | 13.12 |
Data provided by the National Weather Service.