« Back to Glen Campbell Rivers
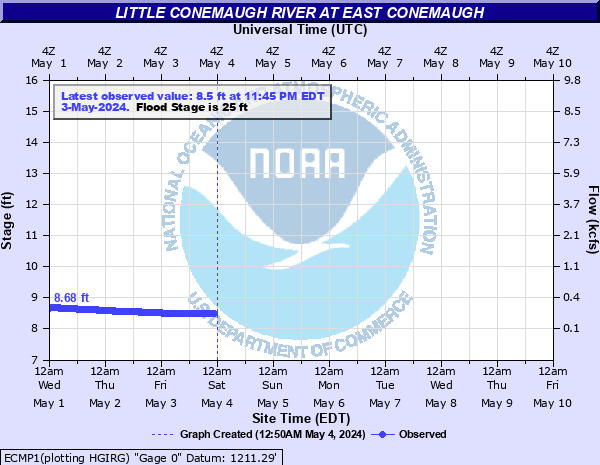
Little Conemaugh River at East Conemaugh
Critical Stages
22' - Action
25' - Flood
27' - Moderate
28' - Major
Latest Observation
Updated: 4:45 PM EST 12/15/25
Status: No Flooding
Stage: 8.01 ft
Flow: 0.117 kcfs
Forecast
Forecast not available for this location.
| Time | Stage (ft) | Flow (kcfs) |
|---|---|---|
| 5:45 PM 12/15 | 8.01 | 0.117 |
| 5:30 PM 12/15 | 8.01 | 0.117 |
| 5:15 PM 12/15 | 8.01 | 0.117 |
| 5:00 PM 12/15 | 8.01 | 0.117 |
| 4:45 PM 12/15 | 8.01 | 0.117 |
| 4:30 PM 12/15 | 8.01 | 0.117 |
| 4:15 PM 12/15 | 8.01 | 0.117 |
| 4:00 PM 12/15 | 8.01 | 0.117 |
| 3:45 PM 12/15 | 8 | 0.115 |
| 3:30 PM 12/15 | 8 | 0.115 |
| 3:15 PM 12/15 | 8 | 0.115 |
| 3:00 PM 12/15 | 8 | 0.115 |
| 2:45 PM 12/15 | 8 | 0.115 |
| 2:30 PM 12/15 | 8 | 0.115 |
| 2:15 PM 12/15 | 8 | 0.115 |
| 2:00 PM 12/15 | 8 | 0.115 |
| 1:45 PM 12/15 | 7.99 | 0.113 |
| 1:30 PM 12/15 | 7.97 | 0.109 |
| 1:15 PM 12/15 | 7.96 | 0.107 |
| 1:00 PM 12/15 | 7.94 | 0.103 |
| 12:45 PM 12/15 | 7.92 | 0.0995 |
| 12:30 PM 12/15 | 7.9 | 0.096 |
| 12:15 PM 12/15 | 7.9 | 0.096 |
| 12:00 PM 12/15 | 7.9 | 0.096 |
| 11:45 AM 12/15 | 7.9 | 0.096 |
| 11:30 AM 12/15 | 7.88 | 0.0926 |
| 11:15 AM 12/15 | 7.87 | 0.0909 |
| 11:00 AM 12/15 | 7.87 | 0.0909 |
| 10:45 AM 12/15 | 7.86 | 0.0893 |
| 10:30 AM 12/15 | 7.85 | 0.0877 |
28.9' -
Flood of record from 1936.
27' -
Both banks overflow in the vicinity of the gaging station.
25' -
The right bank overflows in the vicinity of the gaging station.
| Date | Stage (ft) |
|---|---|
| Mar 17, 1936 | 28.85 |
| Jan 19, 1996 | 19.78 |
| Jul 20, 1977 | 18.85000038147 |
| Nov 8, 1997 | 17.2 |
| Dec 19, 2008 | 16.54 |
| Mar 24, 1994 | 14 |
| Apr 16, 1993 | 13.83 |
| Jun 23, 1972 | 10.48 |
| Oct 16, 1954 | 8.86 |
| Mar 30, 1940 | 8.8 |
Data provided by the National Weather Service.