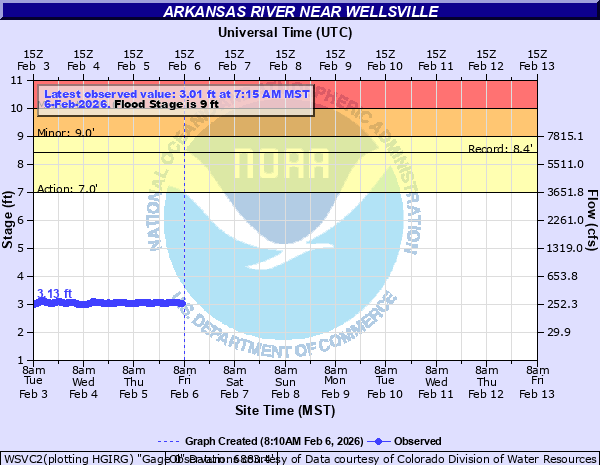
Arkansas River near Wellsville
Critical Stages
7' - Action
9' - Flood
10' - Moderate
11' - Major
Latest Observation
Updated: 7:15 PM MST 12/15/25
Status: No Flooding
Stage: 3.24 ft
Flow: 0.325 kcfs
Forecast
Forecast not available for this location.
| Time | Stage (ft) | Flow (kcfs) |
|---|---|---|
| 7:15 PM 12/15 | 3.24 | 0.325 |
| 7:00 PM 12/15 | 3.24 | 0.325 |
| 6:45 PM 12/15 | 3.25 | 0.328 |
| 6:30 PM 12/15 | 3.25 | 0.328 |
| 6:15 PM 12/15 | 3.25 | 0.328 |
| 6:00 PM 12/15 | 3.26 | 0.331 |
| 5:45 PM 12/15 | 3.25 | 0.328 |
| 5:30 PM 12/15 | 3.25 | 0.328 |
| 5:15 PM 12/15 | 3.25 | 0.328 |
| 5:00 PM 12/15 | 3.25 | 0.328 |
| 4:45 PM 12/15 | 3.25 | 0.328 |
| 4:30 PM 12/15 | 3.25 | 0.328 |
| 4:15 PM 12/15 | 3.25 | 0.328 |
| 4:00 PM 12/15 | 3.25 | 0.328 |
| 3:45 PM 12/15 | 3.24 | 0.325 |
| 3:30 PM 12/15 | 3.25 | 0.328 |
| 3:15 PM 12/15 | 3.24 | 0.325 |
| 3:00 PM 12/15 | 3.24 | 0.325 |
| 2:45 PM 12/15 | 3.24 | 0.325 |
| 2:30 PM 12/15 | 3.24 | 0.325 |
| 2:15 PM 12/15 | 3.23 | 0.321 |
| 2:00 PM 12/15 | 3.24 | 0.325 |
| 1:45 PM 12/15 | 3.24 | 0.325 |
| 1:30 PM 12/15 | 3.24 | 0.325 |
| 1:15 PM 12/15 | 3.25 | 0.328 |
| 1:00 PM 12/15 | 3.25 | 0.328 |
| 12:45 PM 12/15 | 3.25 | 0.328 |
| 12:30 PM 12/15 | 3.25 | 0.328 |
| 12:15 PM 12/15 | 3.24 | 0.325 |
| 12:00 PM 12/15 | 3.25 | 0.328 |
16' -
Flood waters begin to inundate Rincon Recreation Site between Swissvale and Howard just east of mile marker 232.
14.5' -
Flood waters reach the base of the bridge in Cotopaxi.
13' -
Flood waters reach the base of the bridge in Howard and threaten Pleasant Valley RV Park near the bridge.
11' -
Serious inundation of low lying areas along US Highway 50 occurs.
10.5' -
Flood waters rise into low lying areas along US Highway 50.
10' -
Flood waters rise into Four Seasons RV Park in southeast Salida.
9' -
Flood waters begin to inundate Valley Bridge Recreation Site between Howard and Coaldale near mile marker 246. Minor agricultural flooding occurs.
8.5' -
Rising waters begin to threaten Banderas Bunkhouse Motel and RV sites in Howard. Minor overbank flow into low lying areas along the river begins.
7' -
The river is bankfull in spots.
| Date | Stage (ft) |
|---|---|
| Jun 23, 1995 | 8.4 |
| Jun 20, 2015 | 8.17 |
| Jun 10, 1985 | 8.12 |
| Jun 12, 1980 | 8.02 |
| Jun 9, 2024 | 7.91 |
| Jun 15, 2019 | 7.81 |
| Jun 7, 2010 | 7.67 |
| May 25, 1984 | 7.64 |
| Jun 4, 1997 | 7.54 |
| Jun 20, 2017 | 7.47 |
| May 18, 1996 | 7.44 |
| Jul 13, 1965 | 7.36 |
| Jun 20, 2008 | 7.28 |
| Jun 10, 1987 | 7.28 |
| Jun 27, 2011 | 7.23 |
| Jun 6, 2014 | 7.2 |
| Jun 8, 1986 | 7.16 |
| May 31, 2003 | 6.95 |
| Jun 27, 2009 | 6.9 |
| Jun 25, 1999 | 6.8 |
Data provided by the National Weather Service.