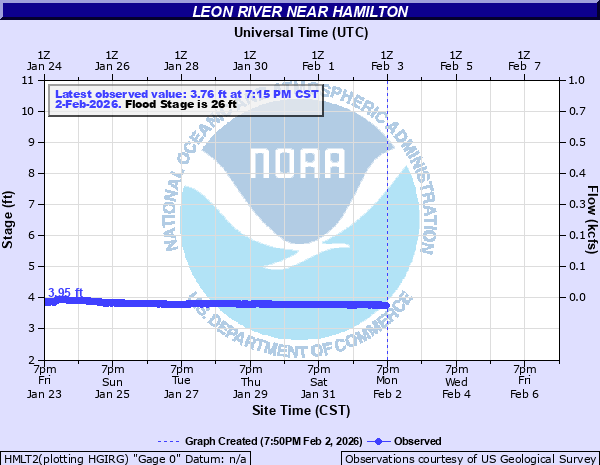
Leon River near Hamilton
Critical Stages
24' - Action
26' - Flood
29' - Moderate
35' - Major
Latest Observation
Updated: 7:15 PM CST 12/15/25
Status: No Flooding
Stage: 3.81 ft
Flow: 0.011 kcfs
Forecast
Forecast not available for this location.
| Time | Stage (ft) | Flow (kcfs) |
|---|---|---|
| 8:15 PM 12/15 | 3.81 | 0.011 |
| 8:00 PM 12/15 | 3.81 | 0.011 |
| 7:45 PM 12/15 | 3.81 | 0.011 |
| 7:30 PM 12/15 | 3.81 | 0.011 |
| 7:15 PM 12/15 | 3.81 | 0.011 |
| 7:00 PM 12/15 | 3.81 | 0.011 |
| 6:45 PM 12/15 | 3.81 | 0.011 |
| 6:30 PM 12/15 | 3.81 | 0.011 |
| 6:15 PM 12/15 | 3.82 | 0.0111 |
| 6:00 PM 12/15 | 3.81 | 0.011 |
| 5:45 PM 12/15 | 3.81 | 0.011 |
| 5:30 PM 12/15 | 3.81 | 0.011 |
| 5:15 PM 12/15 | 3.82 | 0.0111 |
| 5:00 PM 12/15 | 3.82 | 0.0111 |
| 4:45 PM 12/15 | 3.82 | 0.0111 |
| 4:30 PM 12/15 | 3.82 | 0.0111 |
| 4:15 PM 12/15 | 3.82 | 0.0111 |
| 4:00 PM 12/15 | 3.82 | 0.0111 |
| 3:45 PM 12/15 | 3.82 | 0.0111 |
| 3:30 PM 12/15 | 3.82 | 0.0111 |
| 3:15 PM 12/15 | 3.82 | 0.0111 |
| 3:00 PM 12/15 | 3.82 | 0.0111 |
| 2:45 PM 12/15 | 3.82 | 0.0111 |
| 2:30 PM 12/15 | 3.82 | 0.0111 |
| 2:15 PM 12/15 | 3.82 | 0.0111 |
| 2:00 PM 12/15 | 3.82 | 0.0111 |
| 1:45 PM 12/15 | 3.82 | 0.0111 |
| 1:30 PM 12/15 | 3.83 | 0.0111 |
| 1:15 PM 12/15 | 3.83 | 0.0111 |
| 1:00 PM 12/15 | 3.82 | 0.0111 |
38.4' -
Major flooding can be expected along the river. This equals the flood of record.
37' -
Major flooding is expected along the river. US 281 will begin to flood at the southern bridge approach. Multiple low water crossings and county roads, including CR 101 upstream of the gage, will be significantly impacted.
35' -
Major flooding is expected along the river. Flooding along CR 101 upstream of the gage will extend from the low water crossing to the southern bridge approach. Several low water crossings will be flooded.
33' -
Moderate flooding is expected along the river. Several low water crossings will be impacted.
31' -
Moderate flooding is expected along the river.
29' -
Moderate flooding is expected along the river.
26' -
Minor flooding is expected along the river.
| Date | Stage (ft) |
|---|---|
| Dec 1, 1913 | 38.4 |
| May 1, 1908 | 38.4 |
| Sep 1, 1911 | 37 |
| Dec 20, 1991 | 35.02 |
| Oct 1, 1959 | 34.1 |
| Feb 20, 1997 | 33.42 |
| May 4, 1990 | 33.26 |
| Jun 6, 2016 | 31.5 |
| May 29, 2015 | 31.47 |
| Jun 15, 2016 | 31.35 |
| Aug 6, 2008 | 31.26 |
| Mar 28, 1989 | 31.15 |
| Jun 2, 1988 | 31.13 |
| Apr 4, 1995 | 29.95 |
| Sep 3, 1986 | 29.14 |
| May 27, 2015 | 28.95 |
| Mar 16, 1998 | 28.64 |
| May 5, 2024 | 28.36 |
| Aug 29, 1996 | 28.22 |
| May 2, 2007 | 27.5 |
Data provided by the National Weather Service.