Eel River (IN) at North Manchester
Critical Stages
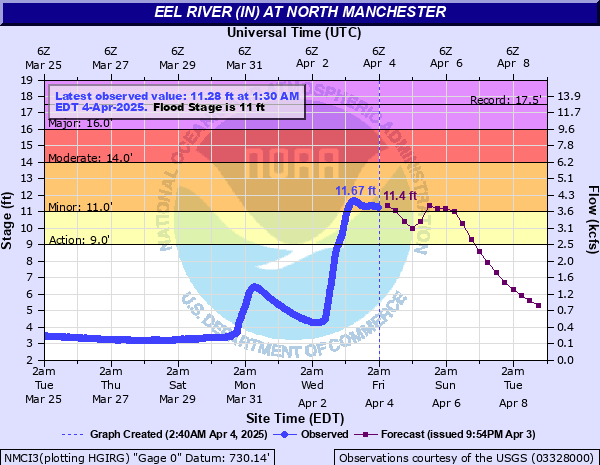
9' - Action
11' - Flood
14' - Moderate
16' - Major
Latest Observation
Updated: 5:30 PM EST 12/15/25
Status: No Flooding
Stage: 2.92 ft
Flow: 0.12 kcfs
Forecast
Forecast not available for this location.
| Time | Stage (ft) | Flow (kcfs) |
|---|---|---|
| 5:30 PM 12/15 | 2.92 | 0.12 |
| 5:15 PM 12/15 | 2.93 | 0.121 |
| 5:00 PM 12/15 | 3.08 | 0.147 |
| 4:45 PM 12/15 | 3.19 | 0.167 |
| 4:30 PM 12/15 | 3.26 | 0.181 |
| 4:15 PM 12/15 | 3.31 | 0.192 |
| 4:00 PM 12/15 | 3.28 | 0.186 |
| 3:45 PM 12/15 | 3.2 | 0.169 |
| 3:30 PM 12/15 | 2.77 | 0.0958 |
| 3:15 PM 12/15 | 2.91 | 0.118 |
| 3:00 PM 12/15 | 2.9 | 0.116 |
| 2:45 PM 12/15 | 2.89 | 0.115 |
| 2:30 PM 12/15 | 2.91 | 0.118 |
| 2:15 PM 12/15 | 2.94 | 0.123 |
| 2:00 PM 12/15 | 2.94 | 0.123 |
| 1:45 PM 12/15 | 2.94 | 0.123 |
| 1:30 PM 12/15 | 2.95 | 0.125 |
| 1:15 PM 12/15 | 2.95 | 0.125 |
| 1:00 PM 12/15 | 2.95 | 0.125 |
| 12:45 PM 12/15 | 2.95 | 0.125 |
| 12:30 PM 12/15 | 2.95 | 0.125 |
| 12:15 PM 12/15 | 2.95 | 0.125 |
| 12:00 PM 12/15 | 2.94 | 0.123 |
| 11:45 AM 12/15 | 2.94 | 0.123 |
| 11:30 AM 12/15 | 2.93 | 0.121 |
| 11:15 AM 12/15 | 2.92 | 0.12 |
| 11:00 AM 12/15 | 2.92 | 0.12 |
| 10:45 AM 12/15 | 2.92 | 0.12 |
| 10:30 AM 12/15 | 2.84 | 0.107 |
| 10:15 AM 12/15 | 3.21 | 0.171 |
18' -
A record flood is in progress. Extensive flooding in progress along South Mill Street and Riverside Road, south of the business district. Flood waters spillin to the North Manchester Street Department parking lot on Wabash Road.
17' -
Near record flood. South Mill Street and Riverside Road flooded.
16' -
Flood waters approach Thrift Shop on South Mill Street.
15.5' -
Significant flood problems in southwest Whitley and northeast Wabash Counties along the Eel River.
13' -
Flood waters approach businesses and homes on South Mill Street.
11' -
The river is at flood stage, minor agricultural flooding occurs.
9' -
The river is at bankfull. Overflow of agricultural fields begins.
| Date | Stage (ft) |
|---|---|
| Mar 27, 1913 | 17.5 |
| Feb 1, 1983 | 17.2 |
| Dec 30, 1990 | 16.81 |
| Apr 19, 2013 | 16.46 |
| Mar 11, 2009 | 16.21 |
| Feb 6, 2008 | 16.09 |
| Feb 27, 1936 | 16 |
| Feb 24, 1985 | 15.76 |
| Mar 13, 1982 | 15.72 |
| Dec 8, 1966 | 15.68 |
| Dec 22, 1967 | 15.55 |
| Jun 16, 2015 | 15.51 |
| Jul 8, 2017 | 15.44 |
| Jun 26, 1938 | 15.38 |
| Feb 10, 1959 | 15.32 |
| Jul 24, 1997 | 15.07 |
| Apr 4, 1950 | 15.04 |
| Jan 13, 2005 | 15.01 |
| Jun 14, 2004 | 14.99 |
| Jan 4, 1950 | 14.85 |
Data provided by the National Weather Service.