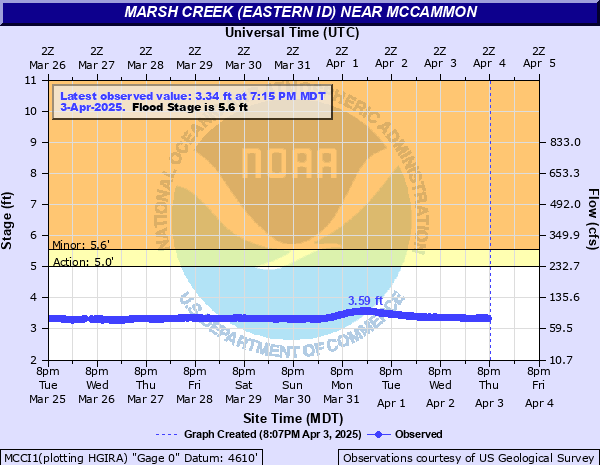
Marsh Creek (Eastern ID) near McCammon
Critical Stages
4.99' - Action
5.55' - Flood
Moderate
Major
Latest Observation
Updated: 12:15 PM MST 12/15/25
Status: No Flooding
Stage: 2.79 ft
Flow: 0.048 kcfs
Forecast
Forecast not available for this location.
| Time | Stage (ft) | Flow (kcfs) |
|---|---|---|
| 12:15 PM 12/15 | 2.79 | 0.048 |
| 12:00 PM 12/15 | 2.79 | 0.048 |
| 11:45 AM 12/15 | 2.79 | 0.048 |
| 11:30 AM 12/15 | 2.77 | 0.047 |
| 11:15 AM 12/15 | 2.79 | 0.048 |
| 11:00 AM 12/15 | 2.79 | 0.048 |
| 10:45 AM 12/15 | 2.78 | 0.048 |
| 10:30 AM 12/15 | 2.79 | 0.048 |
| 10:15 AM 12/15 | 2.79 | 0.048 |
| 10:00 AM 12/15 | 2.79 | 0.048 |
| 9:45 AM 12/15 | 2.78 | 0.048 |
| 9:30 AM 12/15 | 2.79 | 0.048 |
| 9:15 AM 12/15 | 2.79 | 0.048 |
| 9:00 AM 12/15 | 2.79 | 0.048 |
| 8:45 AM 12/15 | 2.79 | 0.048 |
| 8:30 AM 12/15 | 2.79 | 0.048 |
| 8:15 AM 12/15 | 2.78 | 0.048 |
| 8:00 AM 12/15 | 2.79 | 0.048 |
| 7:45 AM 12/15 | 2.79 | 0.048 |
| 7:30 AM 12/15 | 2.8 | 0.049 |
| 7:15 AM 12/15 | 2.78 | 0.048 |
| 7:00 AM 12/15 | 2.79 | 0.048 |
| 6:45 AM 12/15 | 2.79 | 0.048 |
| 6:30 AM 12/15 | 2.79 | 0.048 |
| 6:15 AM 12/15 | 2.79 | 0.048 |
| 6:00 AM 12/15 | 2.79 | 0.048 |
| 5:45 AM 12/15 | 2.79 | 0.048 |
| 5:30 AM 12/15 | 2.79 | 0.048 |
| 5:15 AM 12/15 | 2.79 | 0.048 |
| 5:00 AM 12/15 | 2.79 | 0.048 |
5.55' -
Lowland flooding of fields and cropland possible from Downata Hot Springs to the confluence of the Portneuf River. Widespread water ponding from the confluence of the Portneuf to Walk Creek Road. Possible water ponding upstream Merrill Road, Goodenough Road, Robin Road, Arimo Road, Sublette Road, and Marsh Valley Road.
4.99' -
Near bankfull from Downata Hot Springs to the confluence of the Portneuf River. Isolated areas of lowland flooding possible along with ponding.
| Date | Stage (ft) |
|---|---|
| May 17, 1984 | 13.85 |
| Feb 12, 1962 | 13.25 |
| Jan 15, 1980 | 11.98 |
| May 14, 1971 | 9.59 |
| May 19, 1975 | 9.4 |
| Feb 1, 1963 | 9.31 |
| May 13, 1976 | 9 |
| May 11, 1974 | 8.32 |
| May 9, 1972 | 8.19 |
| Feb 11, 2017 | 8.07 |
| Apr 25, 1969 | 7.62 |
| Dec 23, 1964 | 7.14 |
| Mar 29, 1969 | 7.03 |
| Mar 13, 1971 | 6.88 |
| Feb 25, 1958 | 6.72 |
| Mar 3, 1983 | 6.24 |
| Mar 1, 2006 | 5.97 |
| Feb 16, 2007 | 5.52 |
| Mar 23, 2018 | 5.13 |
| Jan 17, 2011 | 5.11 |
Data provided by the National Weather Service.