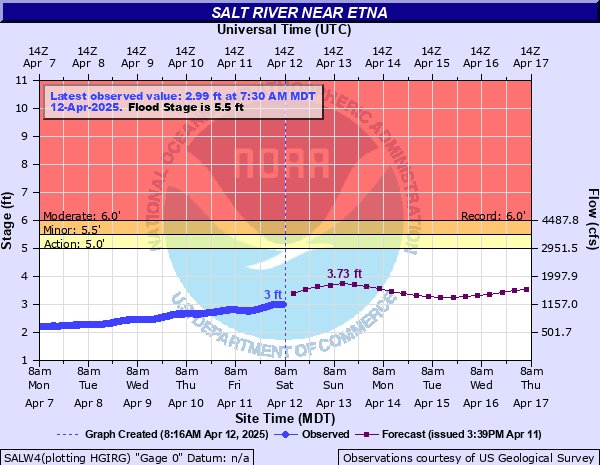
Salt River (WY) near Etna
Critical Stages
5' - Action
5.5' - Flood
6' - Moderate
Major
Latest Observation
Updated: 12:30 PM MST 12/15/25
Status: No Flooding
Stage: 1.94 ft
Flow: 0.465 kcfs
Forecast
| Time | Stage (ft) | Flow (kcfs) |
|---|---|---|
| 5 PM 12/15 | 1.95 | 0.471 |
| 11 PM 12/15 | 1.95 | 0.471 |
| 5 AM 12/16 | 1.96 | 0.477 |
| 11 AM 12/16 | 1.96 | 0.477 |
| 5 PM 12/16 | 1.96 | 0.477 |
| 11 PM 12/16 | 1.96 | 0.477 |
| 5 AM 12/17 | 1.96 | 0.477 |
| 11 AM 12/17 | 1.96 | 0.477 |
| 5 PM 12/17 | 1.96 | 0.477 |
| 11 PM 12/17 | 1.96 | 0.477 |
| 5 AM 12/18 | 1.96 | 0.477 |
| 11 AM 12/18 | 1.96 | 0.477 |
| 5 PM 12/18 | 1.96 | 0.477 |
| 11 PM 12/18 | 1.96 | 0.477 |
| 5 AM 12/19 | 1.96 | 0.477 |
| 11 AM 12/19 | 1.96 | 0.477 |
| 5 PM 12/19 | 1.95 | 0.471 |
| 11 PM 12/19 | 1.95 | 0.471 |
| 5 AM 12/20 | 1.95 | 0.471 |
| 11 AM 12/20 | 1.95 | 0.471 |
| 5 PM 12/20 | 1.95 | 0.471 |
| 11 PM 12/20 | 1.95 | 0.471 |
| 5 AM 12/21 | 1.95 | 0.471 |
| 11 AM 12/21 | 1.95 | 0.471 |
| 5 PM 12/21 | 1.95 | 0.471 |
| 11 PM 12/21 | 1.94 | 0.465 |
| 5 AM 12/22 | 1.94 | 0.465 |
| 11 AM 12/22 | 1.94 | 0.465 |
| 5 PM 12/22 | 1.94 | 0.465 |
| 11 PM 12/22 | 1.94 | 0.465 |
| 5 AM 12/23 | 1.94 | 0.465 |
| 11 AM 12/23 | 1.94 | 0.465 |
| 5 PM 12/23 | 1.94 | 0.465 |
| 11 PM 12/23 | 1.94 | 0.465 |
| 5 AM 12/24 | 1.94 | 0.465 |
| 11 AM 12/24 | 1.94 | 0.465 |
| 5 PM 12/24 | 1.94 | 0.465 |
| 11 PM 12/24 | 1.94 | 0.465 |
| 5 AM 12/25 | 1.94 | 0.465 |
| Time | Stage (ft) | Flow (kcfs) |
|---|---|---|
| 12:30 PM 12/15 | 1.94 | 0.465 |
| 12:15 PM 12/15 | 1.93 | 0.459 |
| 12:00 PM 12/15 | 1.93 | 0.459 |
| 11:45 AM 12/15 | 1.93 | 0.459 |
| 11:30 AM 12/15 | 1.94 | 0.465 |
| 11:15 AM 12/15 | 1.94 | 0.465 |
| 11:00 AM 12/15 | 1.94 | 0.465 |
| 10:45 AM 12/15 | 1.94 | 0.465 |
| 10:30 AM 12/15 | 1.94 | 0.465 |
| 10:15 AM 12/15 | 1.94 | 0.465 |
| 10:00 AM 12/15 | 1.94 | 0.465 |
| 9:45 AM 12/15 | 1.94 | 0.465 |
| 9:30 AM 12/15 | 1.94 | 0.465 |
| 9:15 AM 12/15 | 1.94 | 0.465 |
| 9:00 AM 12/15 | 1.94 | 0.465 |
| 8:45 AM 12/15 | 1.95 | 0.471 |
| 8:30 AM 12/15 | 1.94 | 0.465 |
| 8:15 AM 12/15 | 1.95 | 0.471 |
| 8:00 AM 12/15 | 1.95 | 0.471 |
| 7:45 AM 12/15 | 1.94 | 0.465 |
| 7:30 AM 12/15 | 1.94 | 0.465 |
| 7:15 AM 12/15 | 1.95 | 0.471 |
| 7:00 AM 12/15 | 1.95 | 0.471 |
| 6:45 AM 12/15 | 1.94 | 0.465 |
| 6:30 AM 12/15 | 1.94 | 0.465 |
| 6:15 AM 12/15 | 1.94 | 0.465 |
| 6:00 AM 12/15 | 1.94 | 0.465 |
| 5:45 AM 12/15 | 1.94 | 0.465 |
| 5:30 AM 12/15 | 1.94 | 0.465 |
| 5:15 AM 12/15 | 1.94 | 0.465 |
6' -
Extensive low land flooding in northeastern and northern sections of Afton. Extensive low land flooding upstream in the towns of Freedom and Fairview. Minor flooding of farm/ranch houses upstream and downstream of gage.
5.99' -
Record stage---(5/26/2011).
5.71' -
Record flow---5,090 cfs (6/2/1986).
5.5' -
Flood stage. Low land flooding along Swift Creek in northeastern and northern sections of Afton. Low land flooding becomes more widespread upstream in the towns of Freedom and Fairview. Minor flooding of pastureland/ranchland.
5' -
Bankfull stage. Monitor high water along Swift Creek in northeastern and northern sections of Afton. Small creeks and streams are flooding in the towns of Freedom and Fairview. Minor flooding of ranchland/pastureland near Etna.
4.5' -
Small creeks and streams that flow through the towns of Freeedom and Fairview are at bankfull. Minor flooding along low lying areas in Freedom and Fariview is occurring.
4' -
Small creeks and streams that flow through the towns of Freeedom and Fairview are approaching bankfull. Minor flooding along low lying areas is possible.
3.5' -
Begin monitoring small creeks and streams that flow near Fairview and Freedom.
| Date | Stage (ft) |
|---|---|
| May 25, 2011 | 5.99 |
| May 30, 1983 | 5.96 |
| May 16, 1984 | 5.87 |
| May 13, 2017 | 5.81 |
| Jun 2, 1986 | 5.71 |
| May 18, 1997 | 5.67 |
| Jun 1, 1971 | 5.3 |
| May 28, 1982 | 5.28 |
| May 18, 1996 | 5.26 |
| May 31, 1999 | 5.24 |
| May 20, 1976 | 5.23 |
| May 20, 1972 | 5.2 |
| Apr 17, 2006 | 5.14 |
| May 10, 1974 | 5.08 |
| Jun 8, 1975 | 5.06 |
| Jun 20, 2009 | 5.05 |
| May 22, 1993 | 4.99 |
| May 16, 1978 | 4.81 |
| Jun 9, 1964 | 4.77 |
| May 21, 1973 | 4.76 |
Data provided by the National Weather Service.