« Back to Greenfield Community College Rivers
Walloomsac River near North Bennington
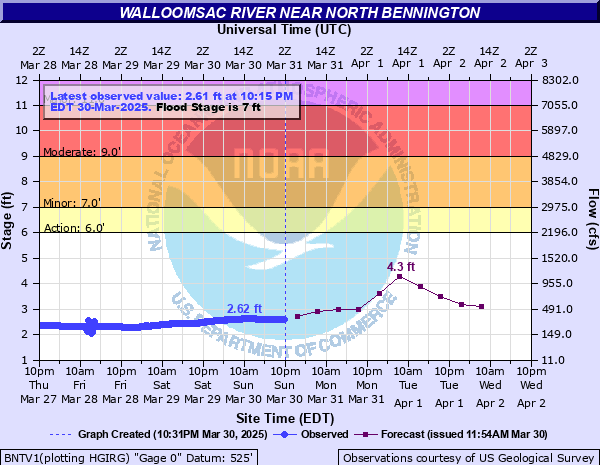
Critical Stages
6' - Action
7' - Flood
9' - Moderate
11' - Major
Latest Observation
Updated: 4:15 PM EST 12/8/25
Status: No Flooding
Stage: 1.75 ft
Flow: 0.0972 kcfs
Forecast
Forecast not available for this location.
| Time | Stage (ft) | Flow (kcfs) |
|---|---|---|
| 5:15 PM 12/8 | 1.75 | 0.0972 |
| 5:00 PM 12/8 | 1.75 | 0.0972 |
| 4:45 PM 12/8 | 1.75 | 0.0972 |
| 4:30 PM 12/8 | 1.75 | 0.0972 |
| 4:15 PM 12/8 | 1.75 | 0.0972 |
| 4:00 PM 12/8 | 1.75 | 0.0972 |
| 3:45 PM 12/8 | 1.75 | 0.0972 |
| 3:30 PM 12/8 | 1.75 | 0.0972 |
| 3:15 PM 12/8 | 1.75 | 0.0972 |
| 3:00 PM 12/8 | 1.75 | 0.0972 |
| 2:45 PM 12/8 | 1.75 | 0.0972 |
| 2:30 PM 12/8 | 1.74 | 0.0953 |
| 2:15 PM 12/8 | 1.74 | 0.0953 |
| 2:00 PM 12/8 | 1.74 | 0.0953 |
| 1:45 PM 12/8 | 1.74 | 0.0953 |
| 1:30 PM 12/8 | 1.74 | 0.0953 |
| 1:15 PM 12/8 | 1.74 | 0.0953 |
| 1:00 PM 12/8 | 1.74 | 0.0953 |
| 12:45 PM 12/8 | 1.75 | 0.0972 |
| 12:30 PM 12/8 | 1.75 | 0.0972 |
| 12:15 PM 12/8 | 1.76 | 0.0991 |
| 12:00 PM 12/8 | 1.76 | 0.0991 |
| 11:45 AM 12/8 | 1.77 | 0.101 |
| 11:30 AM 12/8 | 1.77 | 0.101 |
| 11:15 AM 12/8 | 1.78 | 0.103 |
| 11:00 AM 12/8 | 1.78 | 0.103 |
| 10:45 AM 12/8 | 1.78 | 0.103 |
| 10:30 AM 12/8 | 1.78 | 0.103 |
| 10:15 AM 12/8 | 1.79 | 0.105 |
| 10:00 AM 12/8 | 1.79 | 0.105 |
12.82' -
Flood of record with Tropical Storm Irene in August 2011.
11.6' -
Water approximately covers Ore Bed Road.
10' -
Water is almost to road level.
7' -
Water starts to flood near the Paper Mill Village.
4' -
The river is about half bankfull.
2.5' -
The river is at its normal summertime level.
| Date | Stage (ft) |
|---|---|
| Aug 28, 2011 | 12.82 |
| Sep 21, 1938 | 12.04 |
| Dec 31, 1948 | 11.6 |
| Sep 1, 1950 | 11.5 |
| Mar 18, 1936 | 11.44 |
| Oct 8, 2005 | 11.41 |
| Jun 30, 1973 | 11.28 |
| Mar 14, 1977 | 10.57 |
| Aug 10, 1976 | 10.42 |
| Mar 31, 1987 | 10.32 |
| Jan 19, 1996 | 9.87 |
| Jul 2, 2017 | 9.78 |
| May 11, 1996 | 9.57 |
| Dec 2, 1996 | 9.24 |
| Dec 21, 1973 | 8.8 |
| Dec 18, 2023 | 8.77 |
| Jan 14, 2005 | 8.76 |
| Feb 20, 1981 | 8.62 |
| Sep 7, 2011 | 8.57 |
| Mar 17, 2025 | 8.54 |
Data provided by the National Weather Service.