« Back to Greenfield Community College Rivers
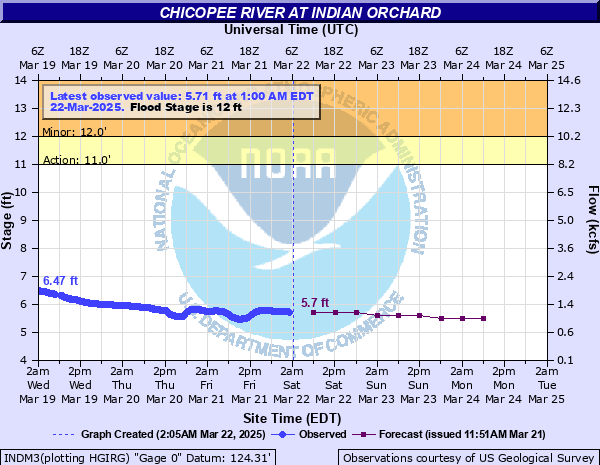
Chicopee River at Indian Orchard
Critical Stages
11' - Action
12' - Flood
16' - Moderate
18' - Major
Latest Observation
Updated: 10:00 AM EST 12/9/25
Status: No Flooding
Stage: 4.03 ft
Flow: 0.134 kcfs
Forecast
| Time | Stage (ft) | Flow (kcfs) |
|---|---|---|
| 1 PM 12/9 | 4.5 | 0.31 |
| 7 PM 12/9 | 4.5 | 0.31 |
| 1 AM 12/10 | 4.5 | 0.31 |
| 7 AM 12/10 | 4.5 | 0.31 |
| 1 PM 12/10 | 4.5 | 0.31 |
| 7 PM 12/10 | 4.6 | 0.356 |
| 1 AM 12/11 | 4.6 | 0.356 |
| 7 AM 12/11 | 4.7 | 0.407 |
| Time | Stage (ft) | Flow (kcfs) |
|---|---|---|
| 10:00 AM 12/9 | 4.03 | 0.134 |
| 9:45 AM 12/9 | 4.04 | 0.137 |
| 9:30 AM 12/9 | 4.04 | 0.137 |
| 9:15 AM 12/9 | 4.04 | 0.137 |
| 9:00 AM 12/9 | 4.05 | 0.139 |
| 8:45 AM 12/9 | 4.06 | 0.142 |
| 8:30 AM 12/9 | 4.07 | 0.145 |
| 8:15 AM 12/9 | 4.08 | 0.148 |
| 8:00 AM 12/9 | 4.1 | 0.154 |
| 7:45 AM 12/9 | 4.12 | 0.16 |
| 7:30 AM 12/9 | 4.15 | 0.169 |
| 7:15 AM 12/9 | 4.18 | 0.179 |
| 7:00 AM 12/9 | 4.23 | 0.196 |
| 6:45 AM 12/9 | 4.28 | 0.214 |
| 6:30 AM 12/9 | 4.33 | 0.234 |
| 6:15 AM 12/9 | 4.34 | 0.238 |
| 6:00 AM 12/9 | 4.35 | 0.242 |
| 5:45 AM 12/9 | 4.35 | 0.242 |
| 5:30 AM 12/9 | 4.36 | 0.246 |
| 5:15 AM 12/9 | 4.37 | 0.25 |
| 5:00 AM 12/9 | 4.37 | 0.25 |
| 4:45 AM 12/9 | 4.37 | 0.25 |
| 4:30 AM 12/9 | 4.38 | 0.254 |
| 4:15 AM 12/9 | 4.38 | 0.254 |
| 4:00 AM 12/9 | 4.39 | 0.259 |
| 3:45 AM 12/9 | 4.39 | 0.259 |
| 3:30 AM 12/9 | 4.4 | 0.263 |
| 3:15 AM 12/9 | 4.4 | 0.263 |
| 3:01 AM 12/9 | 4.4 | 0.263 |
| 3:00 AM 12/9 | 4.4 | 0.263 |
20' -
This is a life threatening flood situation. People along the Chicopee River should seek a safe shelter, inland of the river. Know the alternate routes of travel to avoid driving into flooded areas. Act quickly and follow the directions of your local emergency management officals.
16' -
Significant flooding will occur along the Chicopee River. If you are in a flood prone location, act immediately to protect life and property. Follow the directions of your local emergency management officials. If you are asked to evacuate, do so immediately.
12' -
Minor lowland flooding is likely. Some roadways along the river may become impassable. Do not venture into these areas. Be especially careful near flooded roadways. Never try to cross a flooded road, the road could be damaged or washed out.
| Date | Stage (ft) |
|---|---|
| Sep 21, 1938 | 23.430000305176 |
| Aug 19, 1955 | 22.14 |
| Mar 19, 1936 | 16.2 |
| May 31, 1984 | 13.96 |
| Oct 15, 2005 | 12.92 |
| Mar 7, 1979 | 12.2 |
| Apr 17, 1996 | 10.74 |
| Mar 9, 1995 | 7.6599998474121 |
Data provided by the National Weather Service.