« Back to Greenfield Community College Rivers
Connecticut River at Thompsonville
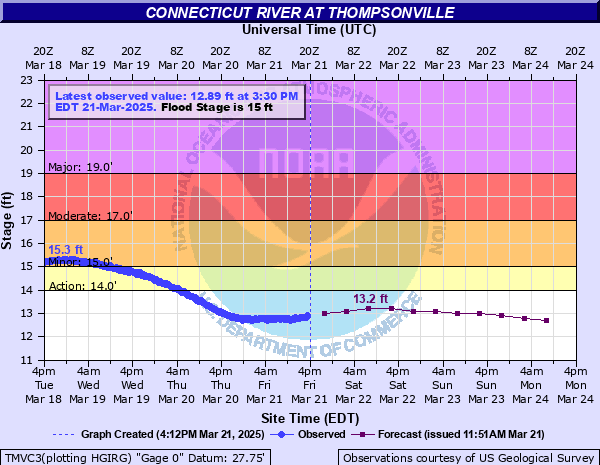
Critical Stages
14' - Action
15' - Flood
17' - Moderate
19' - Major
Latest Observation
Updated: 9:30 AM EST 12/9/25
Status: No Flooding
Stage: 7.98 ft
Flow: 5.08 kcfs
Forecast
| Time | Stage (ft) | Flow (kcfs) |
|---|---|---|
| 1 PM 12/9 | 8.1 | 5.87 |
| 7 PM 12/9 | 8.1 | 5.87 |
| 1 AM 12/10 | 8.1 | 5.87 |
| 7 AM 12/10 | 8.1 | 5.87 |
| 1 PM 12/10 | 8.1 | 5.87 |
| 7 PM 12/10 | 8.1 | 5.87 |
| 1 AM 12/11 | 8.2 | 6.56 |
| 7 AM 12/11 | 8.2 | 6.56 |
| Time | Stage (ft) | Flow (kcfs) |
|---|---|---|
| 9:30 AM 12/9 | 7.98 | 5.08 |
| 9:15 AM 12/9 | 7.97 | 5.01 |
| 9:00 AM 12/9 | 7.96 | 4.95 |
| 8:45 AM 12/9 | 7.95 | 4.88 |
| 8:30 AM 12/9 | 7.95 | 4.88 |
| 8:15 AM 12/9 | 7.94 | 4.82 |
| 8:00 AM 12/9 | 7.94 | 4.82 |
| 7:45 AM 12/9 | 7.93 | 4.75 |
| 7:30 AM 12/9 | 7.93 | 4.75 |
| 7:15 AM 12/9 | 7.93 | 4.75 |
| 7:00 AM 12/9 | 7.93 | 4.75 |
| 6:45 AM 12/9 | 7.92 | 4.69 |
| 6:30 AM 12/9 | 7.93 | 4.75 |
| 6:15 AM 12/9 | 7.93 | 4.75 |
| 6:00 AM 12/9 | 7.92 | 4.69 |
| 5:45 AM 12/9 | 7.93 | 4.75 |
| 5:30 AM 12/9 | 7.93 | 4.75 |
| 5:15 AM 12/9 | 7.93 | 4.75 |
| 5:00 AM 12/9 | 7.93 | 4.75 |
| 4:45 AM 12/9 | 7.94 | 4.82 |
| 4:30 AM 12/9 | 7.94 | 4.82 |
| 4:15 AM 12/9 | 7.94 | 4.82 |
| 4:00 AM 12/9 | 7.94 | 4.82 |
| 3:45 AM 12/9 | 7.94 | 4.82 |
| 3:30 AM 12/9 | 7.95 | 4.88 |
| 3:15 AM 12/9 | 7.94 | 4.82 |
| 3:00 AM 12/9 | 7.95 | 4.88 |
| 2:45 AM 12/9 | 7.95 | 4.88 |
| 2:30 AM 12/9 | 7.95 | 4.88 |
| 2:15 AM 12/9 | 7.95 | 4.88 |
18' -
Significant and widespread flooding along the river can be expected from the Massachusetts towns of Agawam and Longmeadow, through the northern Connecticut towns of Suffield and Enfield.
17' -
Flooding will become more widespread along the Connecticut River from the Massachusetts towns of Agawam and Longmeadow, through the northern Connecticut towns of Suffield and Enfield.
16' -
Flooding impacts low lying areas along the Connecticut River from the Massachusetts towns of Agawam and Longmeadow, through the northern Connecticut towns of Suffield and Enfield.
15' -
Lowland flooding will begin along the Connecticut River near Thompsonville.
| Date | Stage (ft) |
|---|---|
| Mar 20, 1936 | 26.6 |
| Jul 23, 1938 | 24.4 |
| Aug 19, 1955 | 20.93 |
| May 31, 1984 | 20.8 |
| Apr 20, 1933 | 20.47 |
| Apr 6, 1960 | 20.01 |
| Jan 1, 1949 | 19.3 |
| Apr 14, 1934 | 18.96 |
| Mar 23, 1948 | 18.93 |
| Apr 1, 1987 | 18.74 |
| Mar 28, 1952 | 18.6 |
| May 6, 1940 | 18.42 |
| Apr 14, 1931 | 18.28 |
| Jan 11, 1935 | 18.14 |
| Aug 30, 2011 | 17.82 |
| Mar 15, 1977 | 17.79 |
| Apr 23, 1969 | 17.53 |
| Apr 1, 1951 | 17.52 |
| Mar 25, 1929 | 17.49 |
| Apr 12, 1931 | 17.46 |
Data provided by the National Weather Service.