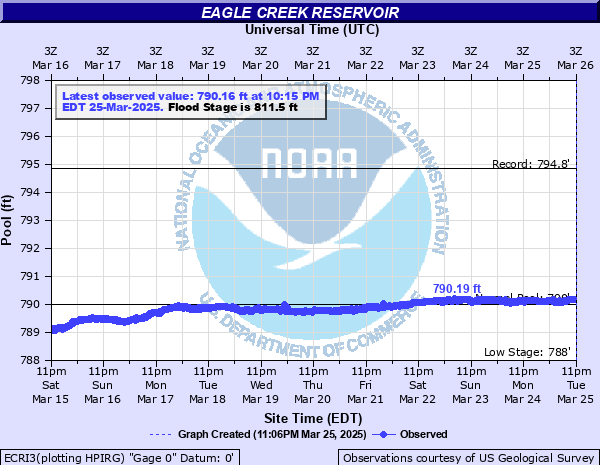
Eagle Creek (IN) at Eagle Creek Reservoir
Critical Stages
811.5' - Action
811.5' - Flood
811.5' - Moderate
811.5' - Major
Latest Observation
Updated: 8:15 PM EST 12/7/25
Status: No Flooding
Stage: 787.55 ft
Flow: -999 kcfs
Forecast
Forecast not available for this location.
| Time | Stage (ft) | Flow (kcfs) |
|---|---|---|
| 8:30 PM 12/7 | 787.57 | -999 |
| 8:15 PM 12/7 | 787.55 | -999 |
| 8:00 PM 12/7 | 787.56 | -999 |
| 7:45 PM 12/7 | 787.55 | -999 |
| 7:30 PM 12/7 | 787.55 | -999 |
| 7:15 PM 12/7 | 787.57 | -999 |
| 7:00 PM 12/7 | 787.57 | -999 |
| 6:45 PM 12/7 | 787.57 | -999 |
| 6:30 PM 12/7 | 787.57 | -999 |
| 6:15 PM 12/7 | 787.55 | -999 |
| 6:00 PM 12/7 | 787.56 | -999 |
| 5:45 PM 12/7 | 787.57 | -999 |
| 5:30 PM 12/7 | 787.57 | -999 |
| 5:15 PM 12/7 | 787.56 | -999 |
| 5:00 PM 12/7 | 787.57 | -999 |
| 4:45 PM 12/7 | 787.56 | -999 |
| 4:30 PM 12/7 | 787.57 | -999 |
| 4:15 PM 12/7 | 787.56 | -999 |
| 4:00 PM 12/7 | -9999 | -999 |
| 3:45 PM 12/7 | -9999 | -999 |
| 3:30 PM 12/7 | 787.57 | -999 |
| 3:15 PM 12/7 | 787.56 | -999 |
| 3:00 PM 12/7 | 787.57 | -999 |
| 2:45 PM 12/7 | 787.56 | -999 |
| 2:30 PM 12/7 | 787.57 | -999 |
| 2:15 PM 12/7 | 787.57 | -999 |
| 2:00 PM 12/7 | 787.56 | -999 |
| 1:45 PM 12/7 | 787.56 | -999 |
| 1:30 PM 12/7 | 787.56 | -999 |
| 1:15 PM 12/7 | 787.57 | -999 |
825' -
Top of the Dam.
816.4' -
Water begins to escape the reservoir through a natural overflow through Eagle Creek Air Park northeast of the dam if the flood tainter gates are inoperable.
814.7' -
Maximum Pool during a Probable Maximum Flood
811.5' -
Flood Control Elevation - Flood Pool
791' -
Summer Pool
789' -
Winter Pool
| Date | Stage (ft) |
|---|---|
| Apr 19, 2013 | 794.84 |
| May 11, 2003 | 794.84 |
| Jul 14, 2015 | 792.85 |
| Apr 17, 2006 | 792.5 |
| Apr 30, 2017 | 792.35 |
| Jan 13, 2013 | 792.32 |
| Mar 25, 2009 | 782.53 |
Data provided by the National Weather Service.