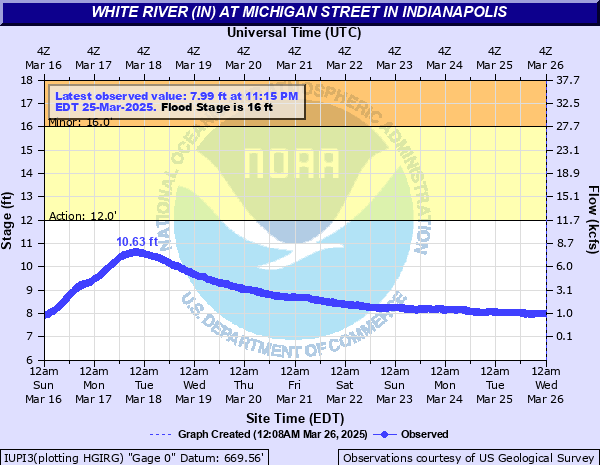
White River (IN) at Michigan Street in Indianapolis
Critical Stages
12' - Action
16' - Flood
20' - Moderate
30' - Major
Latest Observation
Updated: 8:30 PM EST 12/7/25
Status: No Flooding
Stage: 7.1 ft
Flow: 0.144 kcfs
Forecast
Forecast not available for this location.
| Time | Stage (ft) | Flow (kcfs) |
|---|---|---|
| 8:30 PM 12/7 | 7.1 | 0.144 |
| 8:15 PM 12/7 | 7.11 | 0.15 |
| 8:00 PM 12/7 | 7.09 | 0.138 |
| 7:45 PM 12/7 | 7.12 | 0.156 |
| 7:30 PM 12/7 | 7.09 | 0.138 |
| 7:15 PM 12/7 | 7.09 | 0.138 |
| 7:00 PM 12/7 | 7.1 | 0.144 |
| 6:45 PM 12/7 | 7.11 | 0.15 |
| 6:30 PM 12/7 | 7.11 | 0.15 |
| 6:15 PM 12/7 | 7.09 | 0.138 |
| 6:00 PM 12/7 | 7.09 | 0.138 |
| 5:45 PM 12/7 | 7.12 | 0.156 |
| 5:30 PM 12/7 | 7.09 | 0.138 |
| 5:15 PM 12/7 | 7.08 | 0.133 |
| 5:00 PM 12/7 | 7.1 | 0.144 |
| 4:45 PM 12/7 | 7.1 | 0.144 |
| 4:30 PM 12/7 | 7.1 | 0.144 |
| 4:15 PM 12/7 | 7.09 | 0.138 |
| 4:00 PM 12/7 | 7.09 | 0.138 |
| 3:45 PM 12/7 | 7.11 | 0.15 |
| 3:30 PM 12/7 | 7.09 | 0.138 |
| 3:15 PM 12/7 | 7.1 | 0.144 |
| 3:00 PM 12/7 | 7.09 | 0.138 |
| 2:45 PM 12/7 | 7.1 | 0.144 |
| 2:30 PM 12/7 | 7.1 | 0.144 |
| 2:15 PM 12/7 | 7.1 | 0.144 |
| 2:00 PM 12/7 | 7.12 | 0.156 |
| 1:45 PM 12/7 | 7.11 | 0.15 |
| 1:30 PM 12/7 | 7.13 | 0.162 |
| 1:15 PM 12/7 | 7.13 | 0.162 |
33.5' -
Water aproaching low steel of Michigan Street bridge over White River and nearing top of levees.
9' -
Water over local flap gates of drainage pipes entering White River at the Michigan Street Bridge.
1' -
Bottom of White River channel below wire weight on the downstream side of Michigan Street bridge.
| Date | Stage (ft) |
|---|---|
| Mar 26, 1913 | 30 |
| Jan 6, 2005 | 20.4 |
| Apr 20, 2013 | 16.3 |
| Feb 7, 2008 | 16.2 |
| Jan 14, 2013 | 15.81 |
| May 6, 2017 | 15.79 |
| Jun 23, 2010 | 15.75 |
| Mar 1, 2011 | 15.68 |
| Dec 23, 2013 | 15.51 |
| Apr 5, 2018 | 15.32 |
| Jun 29, 2015 | 15.26 |
| Apr 5, 2014 | 14.69 |
| Jan 16, 2007 | 14.5 |
| Dec 29, 2015 | 14.16 |
| Dec 3, 2006 | 13.93 |
| Jul 9, 2017 | 13.68 |
| Feb 13, 2009 | 13.52 |
| Feb 26, 2018 | 13.14 |
| Nov 20, 2017 | 13.01 |
| Jan 21, 2017 | 12.89 |
Data provided by the National Weather Service.