« Back to Greenleaf Park Rivers
North Fork Shenandoah River at Cootes Store
Critical Stages
10' - Action
15' - Flood
18' - Moderate
21' - Major
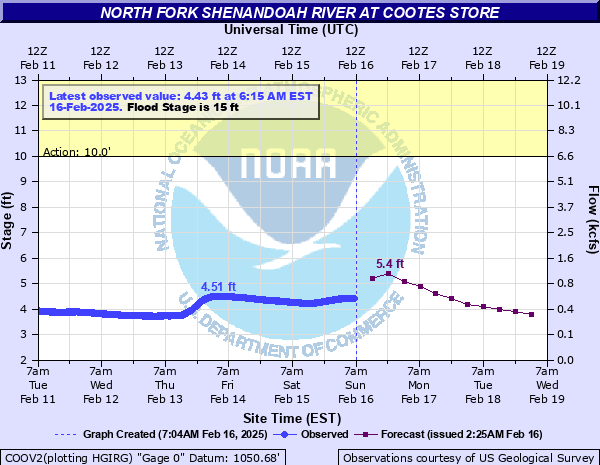
Latest Observation
Updated: 5:15 PM EST 12/15/25
Status: No Flooding
Stage: 2.35 ft
Flow: 0.0113 kcfs
Forecast
| Time | Stage (ft) | Flow (kcfs) |
|---|---|---|
| 7 PM 12/15 | 2.3 | 0.009 |
| 1 AM 12/16 | 2.3 | 0.009 |
| 7 AM 12/16 | 2.3 | 0.009 |
| 1 PM 12/16 | 2.3 | 0.009 |
| 7 PM 12/16 | 2.3 | 0.009 |
| 1 AM 12/17 | 2.3 | 0.009 |
| 7 AM 12/17 | 2.3 | 0.009 |
| 1 PM 12/17 | 2.3 | 0.009 |
| 7 PM 12/17 | 2.3 | 0.009 |
| 1 AM 12/18 | 2.3 | 0.009 |
| 7 AM 12/18 | 2.3 | 0.009 |
| Time | Stage (ft) | Flow (kcfs) |
|---|---|---|
| 5:15 PM 12/15 | 2.35 | 0.0113 |
| 5:00 PM 12/15 | 2.35 | 0.0113 |
| 4:45 PM 12/15 | 2.35 | 0.0113 |
| 4:30 PM 12/15 | 2.35 | 0.0113 |
| 4:15 PM 12/15 | 2.36 | 0.0118 |
| 4:00 PM 12/15 | 2.36 | 0.0118 |
| 3:45 PM 12/15 | 2.36 | 0.0118 |
| 3:30 PM 12/15 | 2.37 | 0.0123 |
| 3:15 PM 12/15 | 2.37 | 0.0123 |
| 3:00 PM 12/15 | 2.37 | 0.0123 |
| 2:45 PM 12/15 | 2.37 | 0.0123 |
| 2:30 PM 12/15 | 2.38 | 0.0128 |
| 2:15 PM 12/15 | 2.38 | 0.0128 |
| 2:00 PM 12/15 | 2.38 | 0.0128 |
| 1:45 PM 12/15 | 2.39 | 0.0134 |
| 1:30 PM 12/15 | 2.39 | 0.0134 |
| 1:15 PM 12/15 | 2.39 | 0.0134 |
| 1:00 PM 12/15 | 2.39 | 0.0134 |
| 12:45 PM 12/15 | 2.4 | 0.014 |
| 12:30 PM 12/15 | 2.4 | 0.014 |
| 12:15 PM 12/15 | 2.39 | 0.0134 |
| 12:00 PM 12/15 | 2.39 | 0.0134 |
| 11:45 AM 12/15 | 2.39 | 0.0134 |
| 11:30 AM 12/15 | 2.38 | 0.0128 |
| 11:15 AM 12/15 | 2.38 | 0.0128 |
| 11:00 AM 12/15 | 2.38 | 0.0128 |
| 10:45 AM 12/15 | 2.37 | 0.0123 |
| 10:30 AM 12/15 | 2.37 | 0.0123 |
| 10:15 AM 12/15 | 2.37 | 0.0123 |
| 10:00 AM 12/15 | 2.36 | 0.0118 |
28' -
Water completely covers the first floor of several buildings near Cootes Store.
21' -
Homes and businesses near Cootes Store begin to flood.
19' -
Large portions of Brocks Gap Road, and parts of Turleytown Road, begin to flood.
18' -
Water reaches buildings near Cootes Store.
15' -
Water reaches fields near Brocks Gap Road and a campground. Low spots on Brocks Gap Road begin to flood.
10' -
Low-lying areas near the river begin to flood.
8' -
The river reaches bankfull level and begins to spill over into nearby portions of the floodplain.
| Date | Stage (ft) |
|---|---|
| Sep 6, 1996 | 27.86 |
| Oct 15, 1942 | 25.3 |
| Nov 4, 1985 | 25.13 |
| Mar 17, 1936 | 23.25 |
| Jan 19, 1996 | 19.71 |
| Oct 5, 1972 | 19.5 |
| Dec 1, 1934 | 19 |
| May 22, 2018 | 17.35 |
| Mar 19, 1975 | 17.29 |
| Apr 25, 1937 | 17 |
| Oct 9, 1976 | 16.98 |
| May 22, 1942 | 16.93 |
| Aug 18, 1955 | 16.6 |
| Jul 9, 1970 | 16.55 |
| Apr 16, 2011 | 16.33 |
| Sep 18, 1945 | 15.9 |
| Sep 5, 1979 | 15.69 |
| Jun 22, 2018 | 15.42 |
| Apr 16, 1929 | 15.4 |
| Aug 17, 1994 | 15.26 |
Data provided by the National Weather Service.