James River near Columbia
Critical Stages
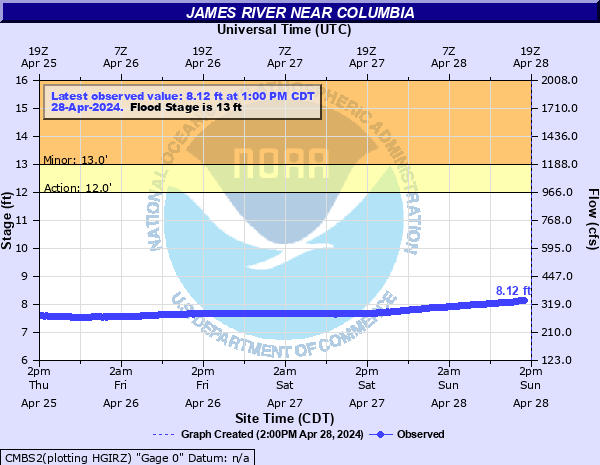
12' - Action
13' - Flood
16' - Moderate
18' - Major
Latest Observation
Updated: 11:00 AM CST 12/16/25
Status: No Flooding
Stage: 8.47 ft
Flow: 0.317 kcfs
Forecast
Forecast not available for this location.
| Time | Stage (ft) | Flow (kcfs) |
|---|---|---|
| 11:00 AM 12/16 | 8.47 | 0.317 |
| 10:45 AM 12/16 | 8.41 | 0.311 |
| 10:30 AM 12/16 | 8.53 | 0.323 |
| 10:15 AM 12/16 | 8.6 | 0.329 |
| 10:00 AM 12/16 | 8.46 | 0.316 |
| 9:45 AM 12/16 | 8.58 | 0.327 |
| 9:30 AM 12/16 | 8.5 | 0.32 |
| 9:15 AM 12/16 | 8.71 | 0.34 |
| 9:00 AM 12/16 | 9.44 | 0.416 |
| 8:45 AM 12/16 | 8.64 | 0.333 |
| 8:30 AM 12/16 | 8.63 | 0.332 |
| 8:15 AM 12/16 | 8.81 | 0.35 |
| 8:00 AM 12/16 | 8.86 | 0.355 |
| 7:45 AM 12/16 | 8.53 | 0.323 |
| 7:30 AM 12/16 | 8.66 | 0.335 |
| 7:00 AM 12/16 | 12.67 | 0.893 |
| 6:45 AM 12/16 | 10.85 | 0.58 |
| 6:30 AM 12/16 | 9.2 | 0.39 |
| 6:15 AM 12/16 | 7.92 | 0.264 |
| 6:00 AM 12/16 | 8.36 | 0.306 |
| 5:45 AM 12/16 | 8.9 | 0.359 |
| 5:30 AM 12/16 | 8.76 | 0.345 |
| 5:15 AM 12/16 | 8.02 | 0.272 |
| 5:00 AM 12/16 | 8.28 | 0.298 |
| 4:45 AM 12/16 | 8.47 | 0.317 |
| 4:30 AM 12/16 | 8.24 | 0.294 |
| 2:00 PM 12/15 | 7.76 | 0.25 |
| 1:45 PM 12/15 | 7.76 | 0.25 |
| 1:30 PM 12/15 | 7.76 | 0.25 |
| 1:15 PM 12/15 | 7.76 | 0.25 |
20' -
The water begin to flow over Brown County Hwy 16 south of the gauge.
19.5' -
The river reaches the top of the levee at the old location of Columbia Park. Also 400th Avenue, 123rd Street, Dakota Ave, Larson Road and Tacoma Loop are flooded.
19.3' -
396th Avenue begins to flood.
18.5' -
The water reaches the bottom of the bridge at the gauging location on Brown County 16.
18' -
117th St between 395th and 400th Ave is flooded.
17' -
Water reaches the base of the levee at the old location of Columbia Park.
15' -
Significant amounts of agricultural lands are flooded.
13' -
Flooding of the lower lying agricultural areas begins.
| Date | Stage (ft) |
|---|---|
| Jul 16, 2011 | 19.81 |
| Apr 24, 2009 | 19.73 |
| Apr 18, 1997 | 19.08 |
| Apr 2, 2010 | 19.05 |
| Apr 21, 2019 | 18.96 |
| Nov 12, 2019 | 18.75 |
| May 31, 2022 | 18.57 |
| May 14, 2023 | 18.03 |
| Apr 23, 2001 | 17.83 |
| May 31, 1999 | 17.1 |
| May 22, 1995 | 16.95 |
| Apr 30, 1996 | 16.89 |
| Apr 18, 1982 | 16.3 |
| Apr 11, 1987 | 15.58 |
| Apr 26, 1994 | 15.57 |
| Jul 10, 2013 | 15.39 |
| Aug 19, 1993 | 15.27 |
| Apr 24, 2018 | 15.22 |
| May 19, 1986 | 15.08 |
| Apr 16, 1984 | 14.75 |
Data provided by the National Weather Service.