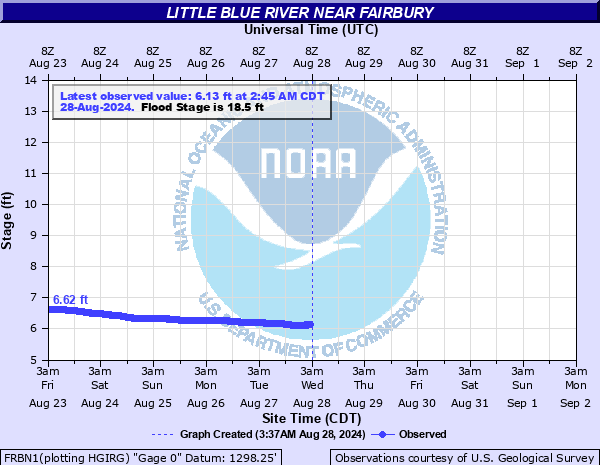
Little Blue River near Fairbury
Critical Stages
17' - Action
18.5' - Flood
20' - Moderate
23' - Major
Latest Observation
Updated: 6:45 AM CST 12/16/25
Status: No Flooding
Stage: 6.93 ft
Flow: 0.0861 kcfs
Forecast
Forecast not available for this location.
| Time | Stage (ft) | Flow (kcfs) |
|---|---|---|
| 6:45 AM 12/16 | 6.93 | 0.0861 |
| 6:30 AM 12/16 | 6.93 | 0.0861 |
| 6:15 AM 12/16 | 6.92 | 0.0854 |
| 6:00 AM 12/16 | 6.92 | 0.0854 |
| 5:45 AM 12/16 | 6.92 | 0.0854 |
| 5:30 AM 12/16 | 6.92 | 0.0854 |
| 5:15 AM 12/16 | 6.92 | 0.0854 |
| 5:00 AM 12/16 | 6.92 | 0.0854 |
| 4:45 AM 12/16 | 6.92 | 0.0854 |
| 4:30 AM 12/16 | 6.92 | 0.0854 |
| 4:15 AM 12/16 | 6.92 | 0.0854 |
| 4:00 AM 12/16 | 6.92 | 0.0854 |
| 3:45 AM 12/16 | 6.92 | 0.0854 |
| 3:30 AM 12/16 | 6.92 | 0.0854 |
| 3:15 AM 12/16 | 6.92 | 0.0854 |
| 3:00 AM 12/16 | 6.92 | 0.0854 |
| 2:45 AM 12/16 | 6.92 | 0.0854 |
| 2:30 AM 12/16 | 6.93 | 0.0861 |
| 2:15 AM 12/16 | 6.93 | 0.0861 |
| 2:00 AM 12/16 | 6.93 | 0.0861 |
| 1:45 AM 12/16 | 6.93 | 0.0861 |
| 1:30 AM 12/16 | 6.94 | 0.0867 |
| 1:15 AM 12/16 | 6.94 | 0.0867 |
| 1:00 AM 12/16 | 6.95 | 0.0874 |
| 12:45 AM 12/16 | 6.95 | 0.0874 |
| 12:30 AM 12/16 | 6.95 | 0.0874 |
| 12:15 AM 12/16 | 6.96 | 0.0881 |
| 12:00 AM 12/16 | 6.96 | 0.0881 |
| 11:45 PM 12/15 | 6.97 | 0.0889 |
| 11:30 PM 12/15 | 6.97 | 0.0889 |
27' -
The top of the levee protecting Fairbury is overtopped. In addition, water may begin to impact the bottom of the Highway 136 bridge.
25.5' -
Highway 136 begins to flood east of the bridge.
23' -
Water will begin to overflow the stop log gate at the railroad tracks near the Highway 136 bridge. At this point water will flow into the town of Fairbury if additional flood protection measures are not taken.
21.5' -
Water starts going over the railroad tracks on the west end of Fairbury.
18.5' -
Frederick Street, located in the southwest corner of Fairbury, is closed due to high water.
17.5' -
Water overtops the right bank at the Highway 136 location, just west of town.
| Date | Stage (ft) |
|---|---|
| May 7, 2015 | 25.48 |
| Jul 25, 1992 | 24.33 |
| Oct 12, 1973 | 23.96 |
| Jun 24, 2003 | 23.17 |
| Jun 13, 1984 | 21.98 |
| Jul 27, 1993 | 21.17 |
| Mar 28, 1960 | 20.8 |
| Mar 24, 1987 | 20.59 |
| Jun 19, 1957 | 20.17 |
| Sep 29, 1983 | 19.87 |
| Aug 2, 2007 | 19.6 |
| Oct 2, 2019 | 19.52 |
| Jul 4, 1982 | 19.42 |
| Jun 14, 2001 | 19.34 |
| Jun 5, 2008 | 19.24 |
| Aug 6, 1985 | 18.55 |
| Jun 25, 1997 | 18.35 |
| Aug 19, 1968 | 17.9 |
| Jul 27, 2020 | 17.85 |
| Sep 3, 1969 | 17.8 |
Data provided by the National Weather Service.