James River at Jamestown
Critical Stages
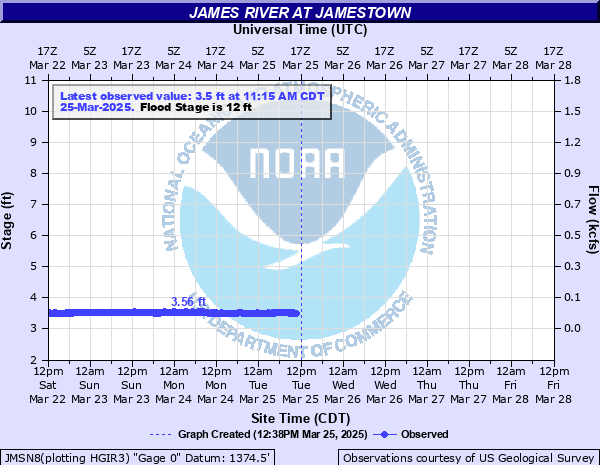
11' - Action
12' - Flood
14' - Moderate
16' - Major
Latest Observation
Updated: 9:15 AM CST 12/15/25
Status: No Flooding
Stage: 4.98 ft
Flow: 0.399 kcfs
Forecast
Forecast not available for this location.
| Time | Stage (ft) | Flow (kcfs) |
|---|---|---|
| 9:15 AM 12/15 | 4.98 | 0.399 |
| 9:00 AM 12/15 | 5 | 0.403 |
| 8:45 AM 12/15 | 4.98 | 0.399 |
| 8:30 AM 12/15 | 4.97 | 0.397 |
| 8:15 AM 12/15 | 5.01 | 0.405 |
| 8:00 AM 12/15 | 4.99 | 0.401 |
| 7:45 AM 12/15 | 4.99 | 0.401 |
| 7:30 AM 12/15 | 4.99 | 0.401 |
| 7:15 AM 12/15 | 5.03 | 0.41 |
| 7:00 AM 12/15 | 5.04 | 0.412 |
| 6:45 AM 12/15 | 5.03 | 0.41 |
| 6:30 AM 12/15 | 5.04 | 0.412 |
| 5:15 AM 12/15 | 5.03 | 0.41 |
| 5:00 AM 12/15 | 5.06 | 0.416 |
| 4:45 AM 12/15 | 5.04 | 0.412 |
| 4:30 AM 12/15 | 5.03 | 0.41 |
| 4:15 AM 12/15 | 5.04 | 0.412 |
| 4:00 AM 12/15 | 5.03 | 0.41 |
| 3:45 AM 12/15 | 5.04 | 0.412 |
| 3:30 AM 12/15 | 5.06 | 0.416 |
| 2:15 AM 12/15 | 5.06 | 0.416 |
| 2:00 AM 12/15 | 5.08 | 0.421 |
| 1:45 AM 12/15 | 5.07 | 0.418 |
| 1:30 AM 12/15 | 5.07 | 0.418 |
| 1:15 AM 12/15 | 5.08 | 0.421 |
| 1:00 AM 12/15 | 5.07 | 0.418 |
| 12:45 AM 12/15 | 5.09 | 0.423 |
| 12:30 AM 12/15 | 5.1 | 0.425 |
| 12:15 AM 12/15 | 5.09 | 0.423 |
| 12:00 AM 12/15 | 5.1 | 0.425 |
16' -
Major damage to homes and businesses at this level.
15' -
Highways 10, 52 and 281 become flooded.
12' -
River is out of its banks at gaging station.
| Date | Stage (ft) |
|---|---|
| Apr 11, 1969 | 16.94 |
| May 13, 1950 | 15.82 |
| Apr 17, 1950 | 15.73 |
| Mar 19, 1966 | 15.18 |
| Apr 23, 1948 | 14.31 |
| Mar 14, 1929 | 14.2 |
| May 4, 2009 | 14.13 |
| Jul 16, 1993 | 13.58 |
| Oct 28, 2019 | 13.24 |
| Sep 20, 2011 | 13.01 |
| Oct 11, 2011 | 12.99 |
| Mar 31, 1943 | 12.77 |
| Jul 5, 1928 | 12.4 |
| Feb 28, 1932 | 12.38 |
| Apr 18, 1997 | 12.04 |
| Mar 11, 1930 | 11.8 |
| Feb 28, 1933 | 11.78 |
| Mar 27, 1960 | 11.76 |
| Apr 12, 1965 | 11.5 |
| Jul 20, 1962 | 11.42 |
Data provided by the National Weather Service.