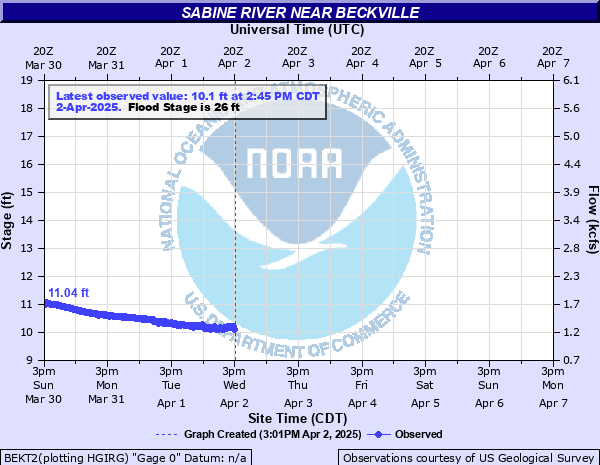
Sabine River near Beckville
Critical Stages
25.5' - Action
26' - Flood
30' - Moderate
35' - Major
Latest Observation
Updated: 6:45 PM CST 12/8/25
Status: No Flooding
Stage: 8.84 ft
Flow: 0.728 kcfs
Forecast
Forecast not available for this location.
| Time | Stage (ft) | Flow (kcfs) |
|---|---|---|
| 7:45 PM 12/8 | 8.84 | 0.728 |
| 7:30 PM 12/8 | 8.84 | 0.728 |
| 7:15 PM 12/8 | 8.84 | 0.728 |
| 7:00 PM 12/8 | 8.84 | 0.728 |
| 6:45 PM 12/8 | 8.84 | 0.728 |
| 6:30 PM 12/8 | 8.85 | 0.732 |
| 6:15 PM 12/8 | 8.85 | 0.732 |
| 6:00 PM 12/8 | 8.86 | 0.736 |
| 5:45 PM 12/8 | 8.86 | 0.736 |
| 5:30 PM 12/8 | 8.86 | 0.736 |
| 5:15 PM 12/8 | 8.86 | 0.736 |
| 5:00 PM 12/8 | 8.86 | 0.736 |
| 4:45 PM 12/8 | 8.87 | 0.741 |
| 4:30 PM 12/8 | 8.87 | 0.741 |
| 4:15 PM 12/8 | 8.87 | 0.741 |
| 4:00 PM 12/8 | 8.87 | 0.741 |
| 3:45 PM 12/8 | 8.88 | 0.745 |
| 3:30 PM 12/8 | 8.88 | 0.745 |
| 3:15 PM 12/8 | 8.88 | 0.745 |
| 3:00 PM 12/8 | 8.88 | 0.745 |
| 2:45 PM 12/8 | 8.88 | 0.745 |
| 2:30 PM 12/8 | 8.89 | 0.749 |
| 2:15 PM 12/8 | 8.89 | 0.749 |
| 2:00 PM 12/8 | 8.89 | 0.749 |
| 1:45 PM 12/8 | 8.89 | 0.749 |
| 1:30 PM 12/8 | 8.89 | 0.749 |
| 1:15 PM 12/8 | 8.9 | 0.753 |
| 1:00 PM 12/8 | 8.9 | 0.753 |
| 12:45 PM 12/8 | 8.91 | 0.757 |
| 12:30 PM 12/8 | 8.91 | 0.757 |
35' -
Severe flooding will continue for the next several days. Thousands of acres of land near the river will flood.
30' -
Expect moderate to severe flooding of the lowland floodplain for the next several days.
28' -
Expect considerable lowland flooding on the reach of the Sabine River from the Tatum through Beckville and DeBerry areas with flooded boat ramps, gas and petroleum wells, and even some low area cabins.
26' -
Expect lowland flooding of the heavily wooded floodplain. In addition, oil field operations in and near the floodplain will be affected and steps should be taken to secure petroleum equipment.
| Date | Stage (ft) |
|---|---|
| Apr 6, 1945 | 40.1 |
| Mar 30, 1989 | 38.87 |
| May 1, 1984 | 37.8 |
| Jun 14, 1943 | 35.8 |
| Jan 31, 1938 | 34 |
| Jun 22, 1993 | 31.71 |
| Jan 5, 2016 | 31.64 |
| May 14, 1990 | 31.4 |
| Mar 11, 2016 | 31.35 |
| May 1, 2016 | 30.43 |
| May 17, 2019 | 30.29 |
| Oct 30, 2009 | 29.9 |
| Dec 29, 2015 | 29.87 |
| May 4, 1991 | 29.32 |
| Mar 12, 2018 | 28.79 |
| Dec 28, 1987 | 28.69 |
| May 29, 2021 | 28.42 |
| Dec 31, 1994 | 28.39 |
| Mar 4, 1997 | 28.33 |
| Jan 4, 1992 | 28.3 |
Data provided by the National Weather Service.