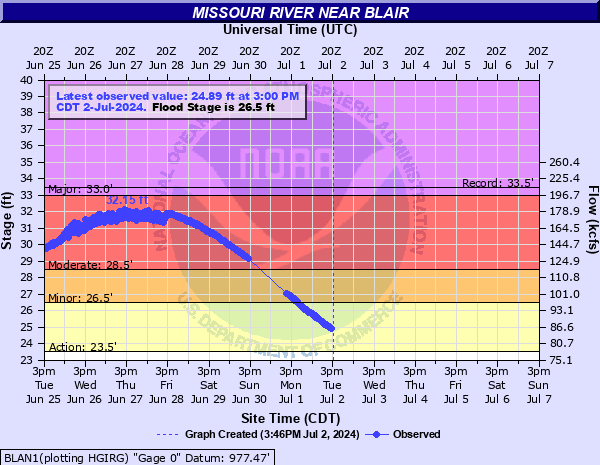
Missouri River near Blair
Critical Stages
23.5' - Action
26.5' - Flood
28.5' - Moderate
33' - Major
Latest Observation
Updated: 9:00 PM CST 12/14/25
Status: No Flooding
Stage: 8.11 ft
Flow: 15.8 kcfs
Forecast
Forecast not available for this location.
| Time | Stage (ft) | Flow (kcfs) |
|---|---|---|
| 9:00 PM 12/14 | 8.11 | 15.8 |
| 8:45 PM 12/14 | 8.13 | 15.8 |
| 8:30 PM 12/14 | 8.14 | 15.8 |
| 8:15 PM 12/14 | 8.14 | 15.8 |
| 8:00 PM 12/14 | 8.13 | 15.8 |
| 7:45 PM 12/14 | 8.16 | 15.9 |
| 7:30 PM 12/14 | 8.17 | 15.9 |
| 7:15 PM 12/14 | 8.18 | 16 |
| 7:00 PM 12/14 | 8.17 | 15.9 |
| 6:45 PM 12/14 | 8.2 | 16 |
| 6:30 PM 12/14 | 8.21 | 16.1 |
| 6:15 PM 12/14 | 8.21 | 16.1 |
| 6:00 PM 12/14 | 8.23 | 16.1 |
| 5:45 PM 12/14 | 8.23 | 16.1 |
| 5:30 PM 12/14 | 8.23 | 16.1 |
| 5:15 PM 12/14 | 8.24 | 16.1 |
| 5:00 PM 12/14 | 8.27 | 16.2 |
| 4:45 PM 12/14 | 8.27 | 16.2 |
| 4:30 PM 12/14 | 8.3 | 16.3 |
| 4:15 PM 12/14 | 8.31 | 16.4 |
| 4:00 PM 12/14 | 8.29 | 16.3 |
| 3:45 PM 12/14 | 8.31 | 16.4 |
| 3:30 PM 12/14 | 8.34 | 16.4 |
| 3:15 PM 12/14 | 8.35 | 16.5 |
| 3:00 PM 12/14 | 8.36 | 16.5 |
| 2:45 PM 12/14 | 8.39 | 16.6 |
| 2:30 PM 12/14 | 8.37 | 16.5 |
| 2:15 PM 12/14 | 8.38 | 16.6 |
| 2:00 PM 12/14 | 8.39 | 16.6 |
| 1:45 PM 12/14 | 8.4 | 16.6 |
33.5' -
Water reaches levels not seen since the flood of 1952. Major flooding will be occurring from Blair to Fort Calhoun.
30' -
Industrial companies along the river near Blair begin to be significantly impacted.
29' -
Floodwaters are impacting Interstate 29 between exit 61 near Crescent and exit 71 near Loveland. In addition water may begin to enter the Desoto NWR.
28' -
Water begins to impact the Interstate 680 ramp near Crescent.
26.5' -
Lowland flooding is occurring. This flooding affects several campgrounds near the river and includes County Roads 34, 47 and 51 east of Fort Calhoun.
23.5' -
Flooding begins to occur at Wilson Island State Park.
| Date | Stage (ft) |
|---|---|
| Apr 17, 1952 | 33.5 |
| Jun 29, 2011 | 32.73 |
| Jun 27, 2024 | 32.2 |
| Mar 18, 2019 | 31.12 |
| Jun 3, 2019 | 29.61 |
| Sep 22, 2019 | 29.19 |
| Sep 25, 2018 | 27.67 |
| Dec 17, 1969 | 27.53 |
| Jun 27, 1984 | 27.48 |
| Jul 10, 1993 | 27.43 |
| Jun 30, 2010 | 26.93 |
| Jun 22, 1996 | 26.91 |
| Feb 19, 1971 | 26.82 |
| Jun 22, 2014 | 26.62 |
| Apr 16, 1997 | 24.87 |
| Jun 3, 1995 | 23.83 |
| Aug 18, 1975 | 23.2 |
| Jun 22, 1983 | 23 |
| Jun 17, 1990 | 22.56 |
| May 29, 2013 | 22.25 |
Data provided by the National Weather Service.