North Fork White River near Tecumseh
Critical Stages
18' - Action
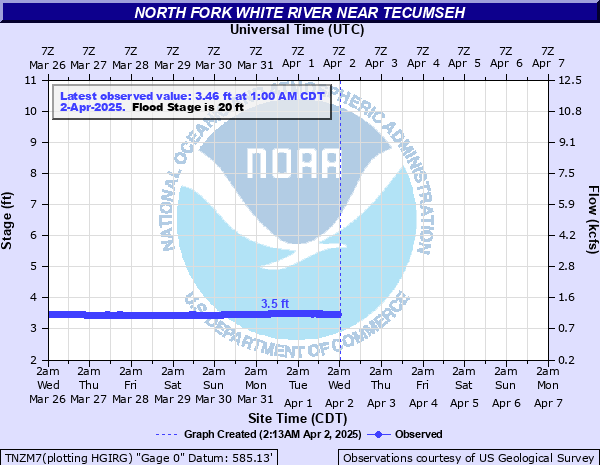
20' - Flood
25' - Moderate
30' - Major
Latest Observation
Updated: 10:00 PM CST 12/9/25
Status: No Flooding
Stage: 2.75 ft
Flow: 0.61 kcfs
Forecast
Forecast not available for this location.
| Time | Stage (ft) | Flow (kcfs) |
|---|---|---|
| 10:00 PM 12/9 | 2.75 | 0.61 |
| 9:45 PM 12/9 | 2.76 | 0.616 |
| 9:30 PM 12/9 | 2.76 | 0.616 |
| 9:15 PM 12/9 | 2.75 | 0.61 |
| 9:00 PM 12/9 | 2.76 | 0.616 |
| 8:45 PM 12/9 | 2.75 | 0.61 |
| 8:30 PM 12/9 | 2.75 | 0.61 |
| 8:15 PM 12/9 | 2.76 | 0.616 |
| 8:00 PM 12/9 | 2.75 | 0.61 |
| 7:45 PM 12/9 | 2.75 | 0.61 |
| 7:30 PM 12/9 | 2.76 | 0.616 |
| 7:15 PM 12/9 | 2.76 | 0.616 |
| 7:00 PM 12/9 | 2.76 | 0.616 |
| 6:45 PM 12/9 | 2.75 | 0.61 |
| 6:30 PM 12/9 | 2.76 | 0.616 |
| 6:15 PM 12/9 | 2.75 | 0.61 |
| 5:45 PM 12/9 | 2.76 | 0.616 |
| 5:30 PM 12/9 | 2.75 | 0.61 |
| 5:15 PM 12/9 | 2.75 | 0.61 |
| 5:00 PM 12/9 | 2.75 | 0.61 |
| 4:45 PM 12/9 | 2.75 | 0.61 |
| 4:30 PM 12/9 | 2.76 | 0.616 |
| 4:15 PM 12/9 | 2.75 | 0.61 |
| 4:00 PM 12/9 | 2.76 | 0.616 |
| 3:45 PM 12/9 | 2.76 | 0.616 |
| 3:30 PM 12/9 | 2.75 | 0.61 |
| 3:15 PM 12/9 | 2.76 | 0.616 |
| 3:00 PM 12/9 | 2.75 | 0.61 |
| 2:45 PM 12/9 | 2.76 | 0.616 |
| 2:30 PM 12/9 | 2.75 | 0.61 |
41.82' -
record crest reached on the evening of April 30, 2017. Widespread damage occurs along the river and larger bridges near the river are overtopped by several feet.
30' -
major flooding impacts locations along the river.
25' -
water level rises to within three feet of the lodge and restaurant at Dawt Mill.
20' -
minor flooding begins near the gage site. Water impacts a park and boat launch at the gage site. Low spots on CR 318 flood.
8' -
flooding occurs at the State Highway H Bridge near the forecast point on the North Fork White River. Flooding affects local residences and recreational businesses that rent canoes. This is considered to be a low water bridge.
| Date | Stage (ft) |
|---|---|
| Apr 30, 2017 | 41.82 |
| Aug 1, 1915 | 35 |
| Nov 19, 1985 | 28.1 |
| Nov 5, 2024 | 27.56 |
| Feb 23, 1985 | 26.28 |
| Nov 14, 1993 | 24.59 |
| Dec 28, 2015 | 24.59 |
| Apr 26, 2011 | 24.58 |
| Mar 19, 2008 | 22.79 |
| Sep 25, 1993 | 22.6 |
| May 8, 2002 | 22.3 |
| Apr 22, 1974 | 22.15 |
| Jan 30, 1969 | 19.33 |
| Feb 10, 1966 | 19.05 |
| Aug 8, 2013 | 18.45 |
| Jan 4, 1950 | 18.05 |
| Dec 3, 1982 | 17.7 |
| Apr 24, 2004 | 17.68 |
| Mar 21, 1955 | 16.95 |
| Apr 15, 1945 | 16.7 |
Data provided by the National Weather Service.