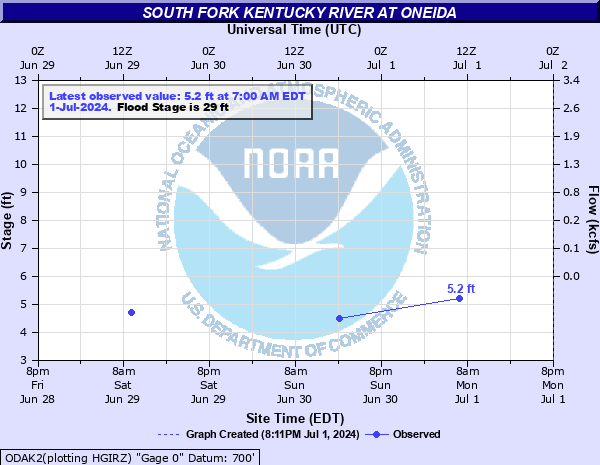
South Fork Kentucky River at Oneida
Critical Stages
18' - Action
29' - Flood
34' - Moderate
38' - Major
Latest Observation
Updated: 7:15 AM EST 12/15/25
Status: No Flooding
Stage: 5.6 ft
Flow: 0.01 kcfs
Forecast
Forecast not available for this location.
| Time | Stage (ft) | Flow (kcfs) |
|---|---|---|
| 7:15 AM 12/15 | 5.6 | 0.01 |
| 7:30 AM 12/14 | 5.6 | 0.01 |
| 7:00 AM 12/13 | 5.7 | 0.014 |
| 7:00 AM 12/12 | 5.8 | 0.02 |
| 7:30 AM 12/11 | 5.3 | -999 |
| 7:00 AM 12/10 | 5.4 | -999 |
| 7:30 AM 12/9 | 5.5 | 0 |
| 7:00 AM 12/9 | 5.5 | 0 |
| 7:00 AM 12/8 | 5.7 | 0.014 |
| 7:00 AM 12/6 | 6.1 | 0.035 |
| 6:45 AM 12/5 | 6.1 | 0.035 |
| 7:15 AM 12/4 | 6.4 | 0.05 |
| 7:15 AM 12/3 | 6.6 | 0.06 |
| 7:15 AM 12/2 | 5.4 | -999 |
| 7:00 AM 12/1 | 5.5 | 0 |
| 7:15 AM 11/30 | 5.6 | 0.01 |
| 7:45 AM 11/29 | 5.6 | 0.01 |
| 7:15 AM 11/28 | 5.8 | 0.02 |
| 9:00 AM 11/27 | 5.9 | 0.025 |
| 7:15 AM 11/26 | 5.6 | 0.01 |
| 7:15 AM 11/25 | 5.5 | 0 |
| 7:00 AM 11/24 | 5.8 | 0.02 |
| 9:00 AM 11/23 | 5.5 | 0 |
| 9:00 AM 11/22 | 5.5 | 0 |
| 7:00 AM 11/21 | 5.5 | 0 |
| 7:00 AM 11/20 | 5.1 | -999 |
| 7:15 AM 11/19 | 5 | -999 |
| 7:00 AM 11/18 | 5 | -999 |
| 7:00 AM 11/17 | 5 | -999 |
| 7:00 AM 11/16 | 5.1 | -999 |
40.19' -
Flooding will exceed the highest flood on record.
38' -
Major flooding occurs. Water is now inundating homes and structures in town.
34' -
Moderate flooding occurs. Several feet of water in multiple Oneida Baptist Institute buildings and the town of Oneida is cut off.
29' -
Low lying areas flood, several feet of water covering the track area behind the Oneida Baptist Institute and water is across the road in front of Town Market.
27.5' -
Water covers Route 66 at the end of Mulberry Street.
25' -
Water enters the Campbell building.
24' -
Water is over the road at the bridge and enters the back shop near the track.
| Date | Stage (ft) |
|---|---|
| Jun 28, 1947 | 40.43 |
| Jan 29, 1957 | 40.19 |
| Mar 12, 1963 | 36.89 |
| Feb 16, 2025 | 34.3 |
| Feb 28, 1962 | 33.88 |
| Apr 28, 1970 | 32.72 |
| Mar 13, 1975 | 32.63 |
| Oct 17, 1989 | 32.6 |
| Apr 5, 1977 | 32.46 |
| Jun 16, 1989 | 32 |
| Mar 7, 1967 | 31.76 |
| Apr 17, 1998 | 31 |
| Apr 12, 1972 | 30.03 |
| Feb 6, 2004 | 29.6 |
| Dec 9, 1978 | 29.36 |
| Dec 31, 1969 | 29 |
| Jan 11, 1974 | 28.35 |
| May 7, 1971 | 27.16 |
| Jun 24, 1960 | 27.05 |
| May 6, 1958 | 27 |
Data provided by the National Weather Service.