« Back to Hastings Municipal Airport Rivers
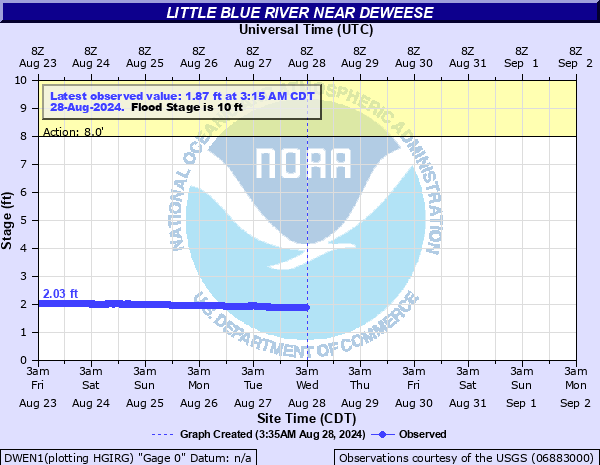
Little Blue River near Deweese
Critical Stages
8' - Action
10' - Flood
16' - Moderate
17' - Major
Latest Observation
Updated: 2:15 PM CST 12/16/25
Status: No Flooding
Stage: 2.16 ft
Flow: 0.0368 kcfs
Forecast
Forecast not available for this location.
| Time | Stage (ft) | Flow (kcfs) |
|---|---|---|
| 2:15 PM 12/16 | 2.16 | 0.0368 |
| 2:00 PM 12/16 | 2.16 | 0.0368 |
| 1:45 PM 12/16 | 2.17 | 0.038 |
| 1:30 PM 12/16 | 2.16 | 0.0368 |
| 11:15 AM 12/16 | 2.17 | 0.038 |
| 11:00 AM 12/16 | 2.17 | 0.038 |
| 10:45 AM 12/16 | 2.18 | 0.0393 |
| 10:30 AM 12/16 | 2.17 | 0.038 |
| 10:15 AM 12/16 | 2.18 | 0.0393 |
| 10:00 AM 12/16 | 2.18 | 0.0393 |
| 9:45 AM 12/16 | 2.18 | 0.0393 |
| 9:30 AM 12/16 | 2.18 | 0.0393 |
| 9:15 AM 12/16 | 2.18 | 0.0393 |
| 9:00 AM 12/16 | 2.19 | 0.0406 |
| 8:45 AM 12/16 | 2.19 | 0.0406 |
| 8:30 AM 12/16 | 2.19 | 0.0406 |
| 8:15 AM 12/16 | 2.19 | 0.0406 |
| 8:00 AM 12/16 | 2.19 | 0.0406 |
| 7:45 AM 12/16 | 2.18 | 0.0393 |
| 7:30 AM 12/16 | 2.19 | 0.0406 |
| 7:15 AM 12/16 | 2.19 | 0.0406 |
| 7:00 AM 12/16 | 2.19 | 0.0406 |
| 6:45 AM 12/16 | 2.2 | 0.042 |
| 6:30 AM 12/16 | 2.2 | 0.042 |
| 6:15 AM 12/16 | 2.2 | 0.042 |
| 6:00 AM 12/16 | 2.19 | 0.0406 |
| 5:45 AM 12/16 | 2.19 | 0.0406 |
| 5:30 AM 12/16 | 2.2 | 0.042 |
| 5:15 AM 12/16 | 2.2 | 0.042 |
| 5:00 AM 12/16 | 2.19 | 0.0406 |
21.5' -
Water reaches the bottom of the Highway 14 bridge.
17' -
Water floods agricultural land and roads near the river. County road 301 and 18c spur road are susceptible to flood waters, cutting off access to Deweese from the south and east. Deweese is not likely to flood.
16' -
Rural farm and pasture land and a few county roads will flood.
10' -
Water overflows rural agricultural land and reaches the base of several buildings located 1.5 miles east of Deweese.
| Date | Stage (ft) |
|---|---|
| Aug 31, 1969 | 20.57 |
| May 22, 1965 | 17.99 |
| Jun 17, 1957 | 17 |
| Jun 26, 1951 | 16.9 |
| Jul 24, 1993 | 16.67 |
| Mar 27, 1960 | 16.45 |
| Aug 4, 1985 | 15.87 |
| Jul 5, 2000 | 14.83 |
| Jun 12, 1967 | 14.72 |
| Jul 2, 1982 | 14.5 |
| May 27, 2019 | 14.35 |
| Jun 26, 1968 | 14.3 |
| Jul 22, 1975 | 13.3 |
| May 22, 1961 | 13.28 |
| Jun 22, 1977 | 13.26 |
| May 25, 1982 | 13.26 |
| Jul 4, 1959 | 12.86 |
| May 20, 1984 | 12.8 |
| Jul 15, 1952 | 12.75 |
| Jul 1, 1989 | 12.6 |
Data provided by the National Weather Service.