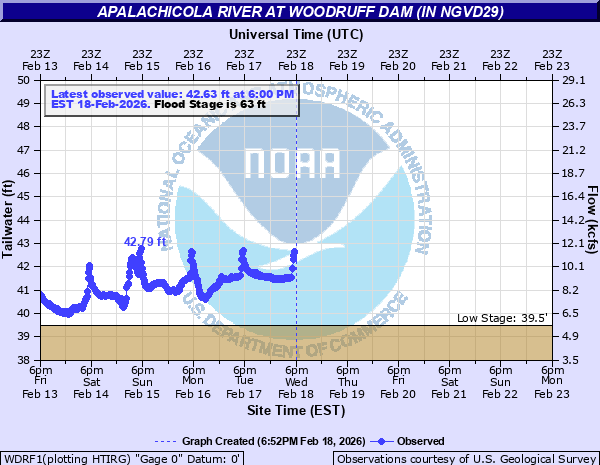
Apalachicola River at Woodruff Dam (in NGVD29)
Critical Stages
56' - Action
63' - Flood
69' - Moderate
74' - Major
Latest Observation
Updated: 8:00 PM EST 12/6/25
Status: No Flooding
Stage: 42.05 ft
Flow: 10.2 kcfs
Forecast
Forecast not available for this location.
| Time | Stage (ft) | Flow (kcfs) |
|---|---|---|
| 8:00 PM 12/6 | 42.05 | 10.2 |
| 7:45 PM 12/6 | 42.04 | 10.2 |
| 7:30 PM 12/6 | 42.15 | 10.4 |
| 7:15 PM 12/6 | 42.26 | 10.6 |
| 7:00 PM 12/6 | 42.29 | 10.7 |
| 6:45 PM 12/6 | 42.37 | 10.8 |
| 6:30 PM 12/6 | 42.47 | 11 |
| 6:15 PM 12/6 | 42.69 | 11.5 |
| 6:00 PM 12/6 | 43.13 | 12.4 |
| 5:45 PM 12/6 | 43.05 | 12.2 |
| 5:30 PM 12/6 | 42.89 | 11.9 |
| 5:15 PM 12/6 | 42.7 | 11.5 |
| 5:00 PM 12/6 | 42.29 | 10.7 |
| 4:45 PM 12/6 | 41.99 | 10.1 |
| 4:30 PM 12/6 | 42.05 | 10.2 |
| 4:15 PM 12/6 | 42.01 | 10.1 |
| 4:00 PM 12/6 | 42.01 | 10.1 |
| 3:45 PM 12/6 | 42.07 | 10.2 |
| 3:30 PM 12/6 | 42.04 | 10.2 |
| 3:15 PM 12/6 | 42.09 | 10.3 |
| 3:00 PM 12/6 | 42.23 | 10.5 |
| 2:45 PM 12/6 | 42.26 | 10.6 |
| 2:30 PM 12/6 | 42.35 | 10.8 |
| 2:15 PM 12/6 | 42.32 | 10.7 |
| 2:00 PM 12/6 | 42.43 | 10.9 |
| 1:45 PM 12/6 | 42.54 | 11.2 |
| 1:30 PM 12/6 | 42.59 | 11.3 |
| 1:15 PM 12/6 | 42.6 | 11.3 |
| 1:00 PM 12/6 | 42.68 | 11.4 |
| 12:45 PM 12/6 | 42.81 | 11.7 |
85' -
Water overtops the emergency spillway on the Gadsden County side of the jim Woodruff Dam, flooding portions of Jim Woodruff Powerdam Road.
84' -
Approach road surface to the interstate 10 bridge in Jackson County begin to flood.
80' -
Water reaches the base of the interstate 10 bridge on the Jackson County side of the river.
79' -
Auxiliary concrete spillway is overtopped on the Jackson County side of the Jim Woodruff Dam.
78' -
In Gadsden County, flooding continues along Mosquito Creek near Main Street. Water reaches the access road to the overpass on the south side of the railroad. Numerous homes are subject to flooding above this level.
77' -
Water reaches the base of the US-90 bridge on the Jackson County side of the river.
74' -
In Gadsden County, a few homes near Main Street along Mosquito Creek are prone to flooding. Water approaches the walking surface of the old US-90 Bridge.
73' -
Water reaches the base of the railroad bridge between Gadsden and Jackson Counties.
72' -
Access to a dock and boat ramp on Gadsden Trail in Jackson County is cutoff near the coal plant. Extensive flooding continues at Ocheesee Landing in Calhoun County. Water approaches residences along Mosquito Creek near the Main Street bridge in Gadsden County.
69' -
The Ocheesee Landing area is completely submerged in Calhoun County.
67' -
Access to River Landing Road in Gadsden County beyond the old US-90 foot bridge access is impossible at or above this level. Access to Ocheesee Landing in Calhoun County becomes impossible as Landshore and Ocheesee landing roads flood extensively at this level.
65' -
Water begins to flood landshore Road and Ocheesee Landing Road near the boat landing in Calhoun County.
64' -
South River Landing road in River Junction in Gadsden County floods at this level. Minor lowland flooding along Mosquito Creek continues between the Mainstreet Bridge and the Apalachicola River.
63' -
Water is over the bank at Ocheesee Boat Landing in Calhoun County causing minor flooding in the area. North River Landing Road in Gadsden County is impassible at and above this level.
62' -
North River Landing Road begins to flood just below the dam near the parking area.
60' -
In Gadsden County, water covers the top of the boat ramp in River Junction. Water spreads through wooded areas near the confluence of Mosquito Creek with the Apalachicola River. In Calhoun County, water begins to flood wooded areas near Ocheesee Landing.
56' -
Water is over the bank in River Junction in Gadsden County. Only the boat ramp area is affected.
| Date | Stage (ft) |
|---|---|
| Jul 10, 1994 | 76.29 |
| Mar 12, 1998 | 76.07 |
| Dec 29, 2015 | 73.66 |
| Mar 9, 2020 | 71.67 |
| Feb 16, 2024 | 67.56 |
| Mar 12, 2024 | 67.54 |
| Apr 11, 2014 | 66.92 |
| Feb 10, 2020 | 66.73 |
| Apr 3, 2016 | 64.54 |
| Feb 6, 2016 | 63.83 |
| Jan 5, 2017 | 63.77 |
| Sep 20, 2020 | 62.89 |
| Apr 9, 2022 | 62.76 |
| Jan 24, 2017 | 62.52 |
| Dec 15, 2018 | 61.23 |
| Jan 17, 2020 | 61.22 |
| Dec 5, 2018 | 61.2 |
| Nov 17, 2018 | 61.17 |
| Feb 1, 2023 | 57.18 |
Data provided by the National Weather Service.