English River at Kalona
Critical Stages
13' - Action
14' - Flood
16' - Moderate
18' - Major
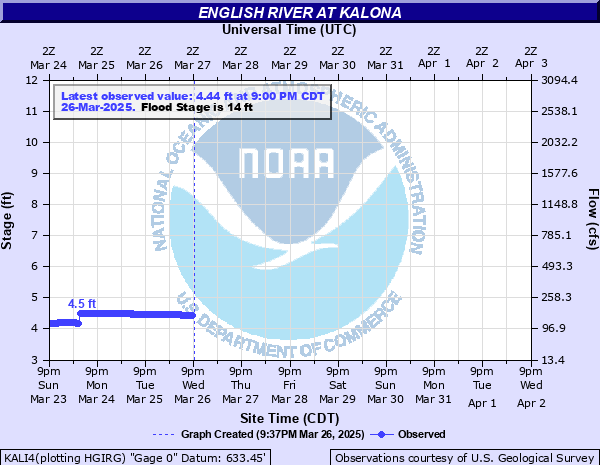
Latest Observation
Updated: 2:00 PM CST 12/15/25
Status: No Flooding
Stage: 3.95 ft
Flow: 0.108 kcfs
Forecast
Forecast not available for this location.
| Time | Stage (ft) | Flow (kcfs) |
|---|---|---|
| 2:00 PM 12/15 | 3.95 | 0.108 |
| 1:45 PM 12/15 | 3.95 | 0.108 |
| 1:30 PM 12/15 | 3.95 | 0.108 |
| 1:15 PM 12/15 | 3.95 | 0.108 |
| 1:00 PM 12/15 | 3.95 | 0.108 |
| 12:45 PM 12/15 | 3.96 | 0.109 |
| 12:30 PM 12/15 | 3.96 | 0.109 |
| 12:15 PM 12/15 | 3.95 | 0.108 |
| 12:00 PM 12/15 | 3.95 | 0.108 |
| 11:45 AM 12/15 | 3.95 | 0.108 |
| 11:30 AM 12/15 | 3.96 | 0.109 |
| 11:15 AM 12/15 | 3.96 | 0.109 |
| 11:00 AM 12/15 | 3.96 | 0.109 |
| 10:45 AM 12/15 | 3.96 | 0.109 |
| 10:30 AM 12/15 | 3.97 | 0.11 |
| 10:15 AM 12/15 | 3.97 | 0.11 |
| 10:00 AM 12/15 | 3.96 | 0.109 |
| 9:45 AM 12/15 | 3.96 | 0.109 |
| 9:30 AM 12/15 | 3.96 | 0.109 |
| 9:15 AM 12/15 | 3.97 | 0.11 |
| 9:00 AM 12/15 | 3.97 | 0.11 |
| 8:45 AM 12/15 | 3.97 | 0.11 |
| 8:30 AM 12/15 | 3.97 | 0.11 |
| 8:15 AM 12/15 | 3.97 | 0.11 |
| 8:00 AM 12/15 | 3.97 | 0.11 |
| 7:45 AM 12/15 | 3.97 | 0.11 |
| 7:30 AM 12/15 | 3.97 | 0.11 |
| 7:15 AM 12/15 | 3.97 | 0.11 |
| 7:00 AM 12/15 | 3.97 | 0.11 |
| 6:45 AM 12/15 | 3.98 | 0.112 |
22.6' -
Water affects Highway 1 north of the bridge.
21' -
Water is at the bottom of the County Road W38 bridge.
18' -
Water has overtopped roads causing closures. This includes 130th St, Kiwi Ave, Orange Ave and Poplar Ave. Extensive agricultural land near the river is flooded. Water begins backing into town on the north side of the river.
17' -
Water begins going over several county roads, including 13th St, Kiwi Ave, Orange Ave and Poplar Ave.
16' -
Water begins approaching several county roads. Agricultural land near the river is flooding.
14' -
Agricultural land along the river begins to flood.
| Date | Stage (ft) |
|---|---|
| Jul 6, 1993 | 22.55 |
| Apr 19, 2013 | 22.47 |
| Jul 2, 2014 | 21.65 |
| Sep 21, 1965 | 21.45 |
| May 11, 1996 | 21.06 |
| May 18, 1974 | 20.17 |
| Jun 18, 1990 | 20.06 |
| Apr 30, 1974 | 19.97 |
| Jun 30, 1930 | 19.9 |
| Mar 31, 1960 | 19.89 |
| Mar 14, 2019 | 19.89 |
| Jan 7, 1946 | 19.74 |
| May 28, 2013 | 19.71 |
| Apr 21, 1993 | 19.38 |
| Mar 10, 2009 | 19.29 |
| May 4, 1993 | 19.23 |
| Sep 8, 2018 | 19.11 |
| Jun 15, 2010 | 19.03 |
| Dec 15, 2015 | 18.98 |
| Sep 27, 1993 | 18.85 |
Data provided by the National Weather Service.